Risk and return
Code
Read the docs →import { ScatterChart } from '@tradecanvas/chart'
new ScatterChart(el, {
series: [{ name: 'Holdings', points }], // { label, x, y, size }
xLabel: 'Volatility',
yLabel: '1-year return',
showLabels: true,
theme: 'dark',
})● Simulated market data, generated in your browser
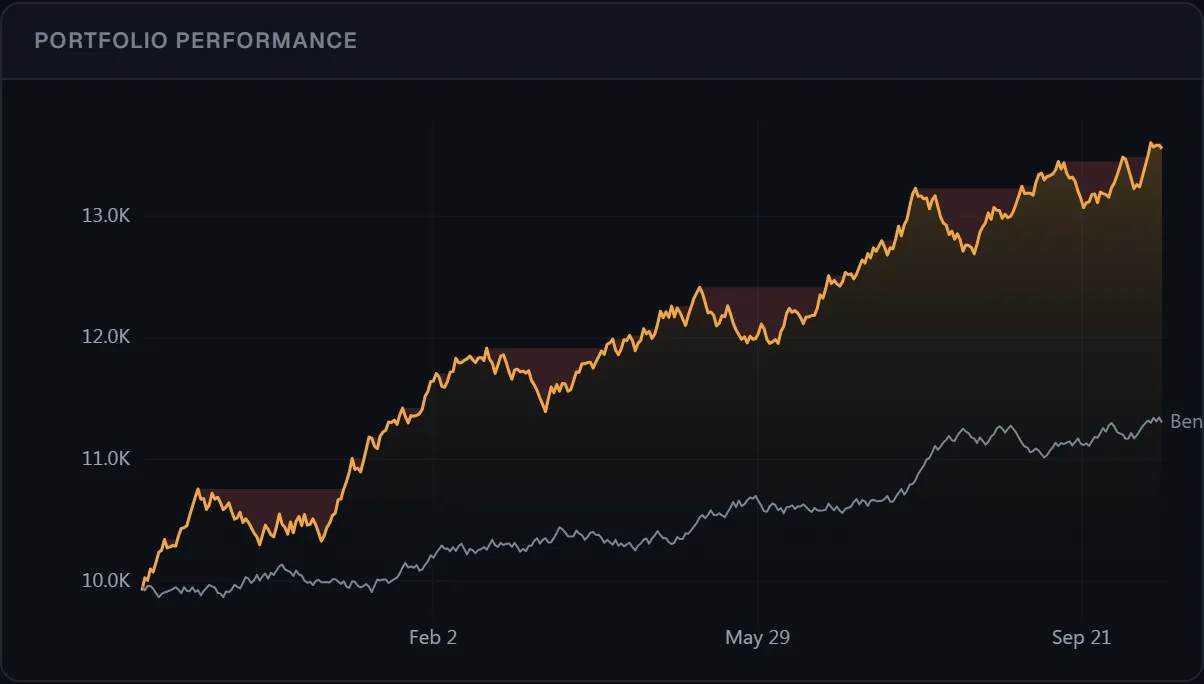
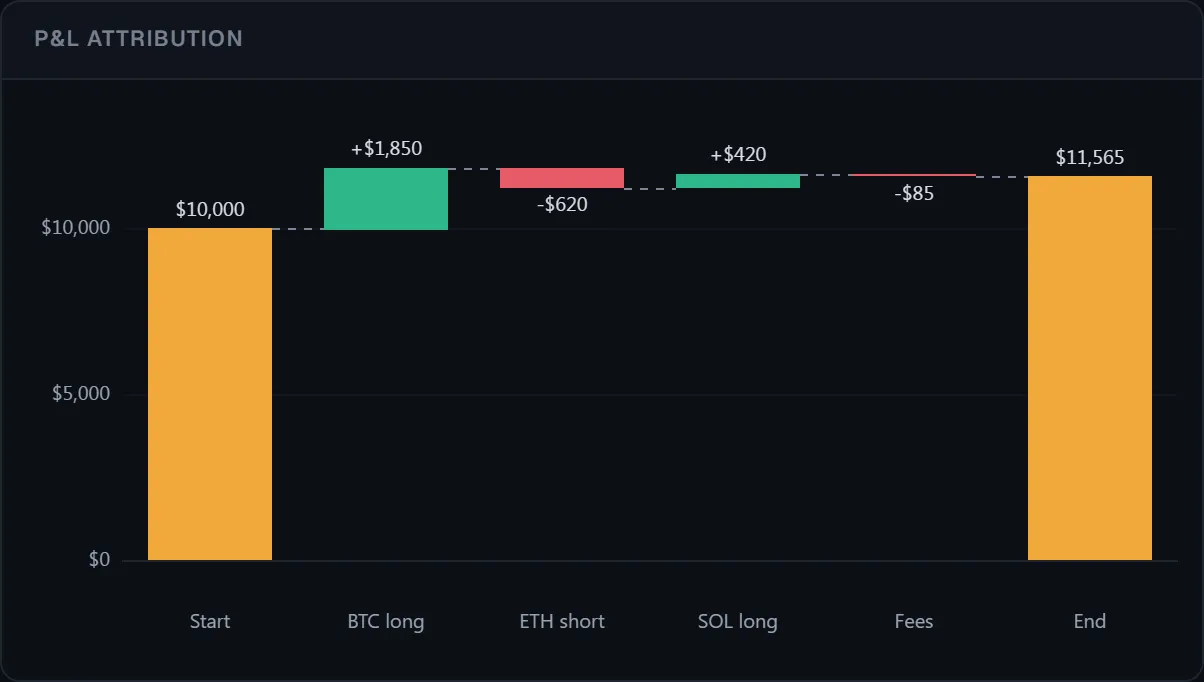
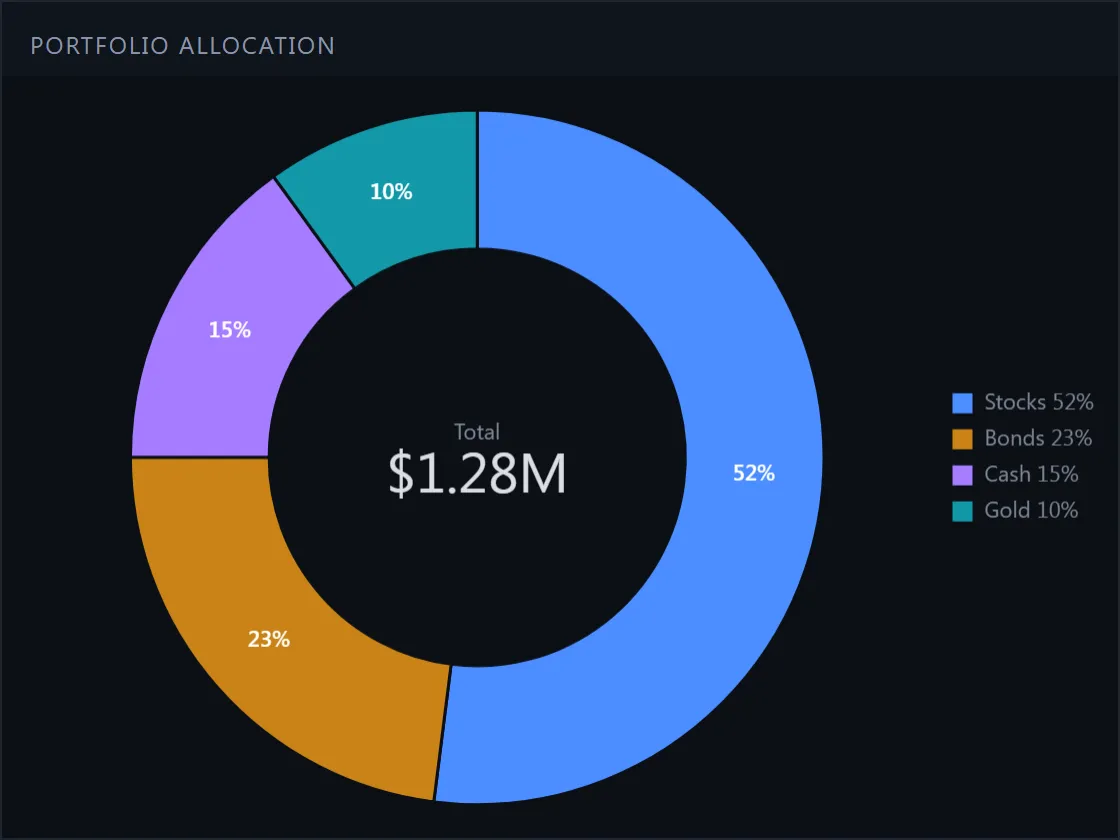
For what a trader reads after the close: P&L, drawdown, allocation, risk and return.
API: ScatterChart