Open source · MIT · free for any market
Built for trading screens and price boards.
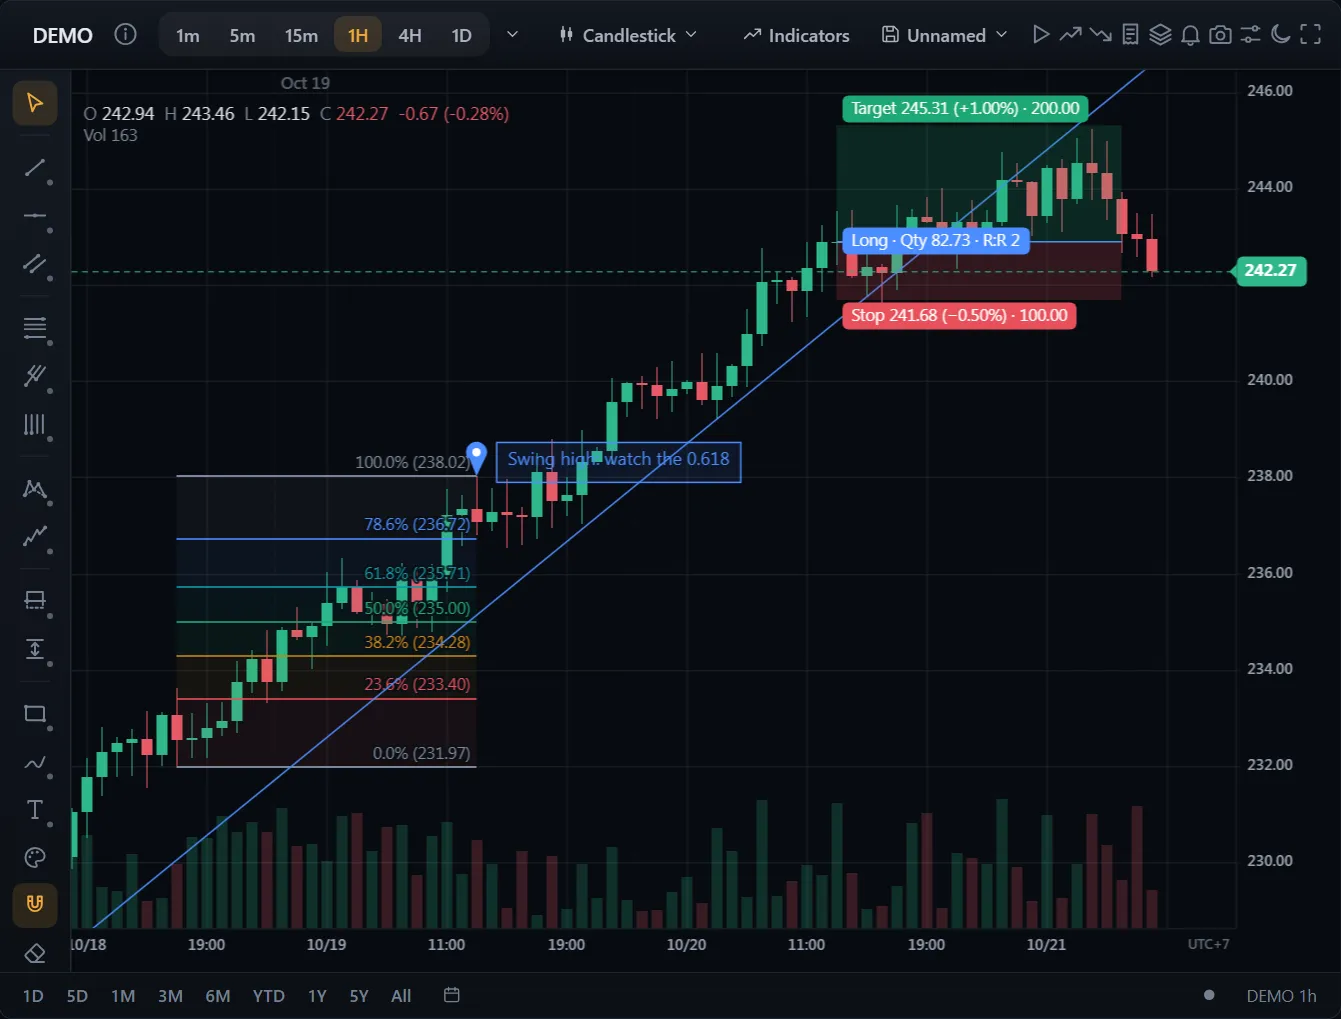
Charts, order entry, order flow and a realtime price board, for any exchange. One API family, every framework, no third-party runtime dependencies.
import { Chart } from '@tradecanvas/chart'

const chart = new Chart(el, { theme: 'dark' })
chart.setData(bars)
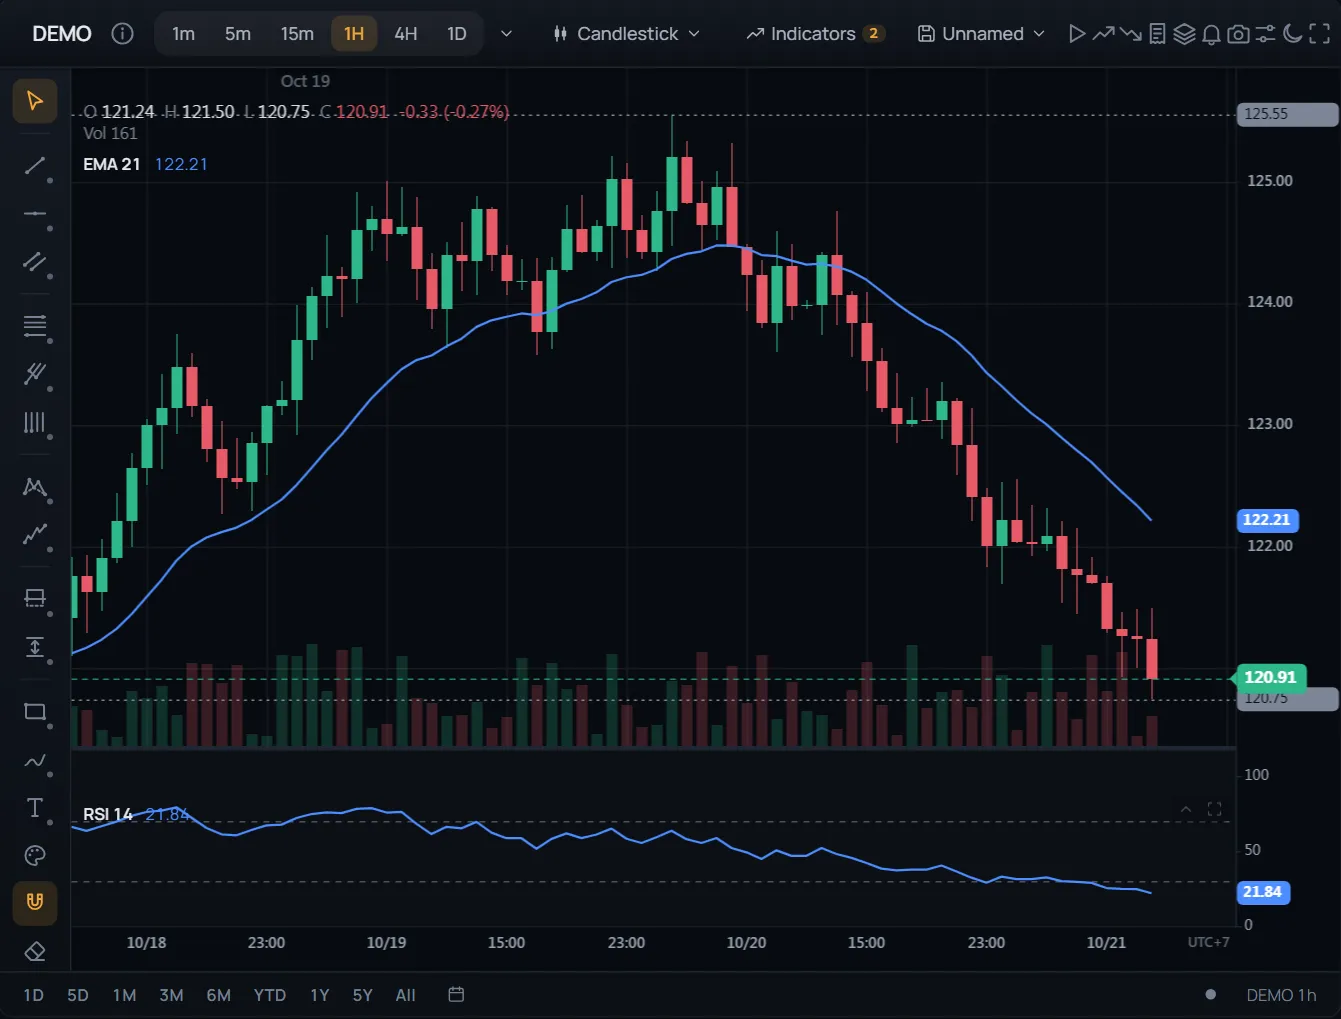
chart.addIndicator('ema', { period: 21 })
import { TradeCanvas } from '@tradecanvas/react'
<TradeCanvas data={bars} theme="dark"
indicators={[{ id: 'ema', params: { period: 21 } }]} /><script setup>
import { TradeCanvas } from '@tradecanvas/vue'
</script>
<TradeCanvas :data="bars" theme="dark" /><script>
import { TradeCanvas } from '@tradecanvas/svelte'
</script>
<TradeCanvas data={bars} theme="dark" />Starting the market…
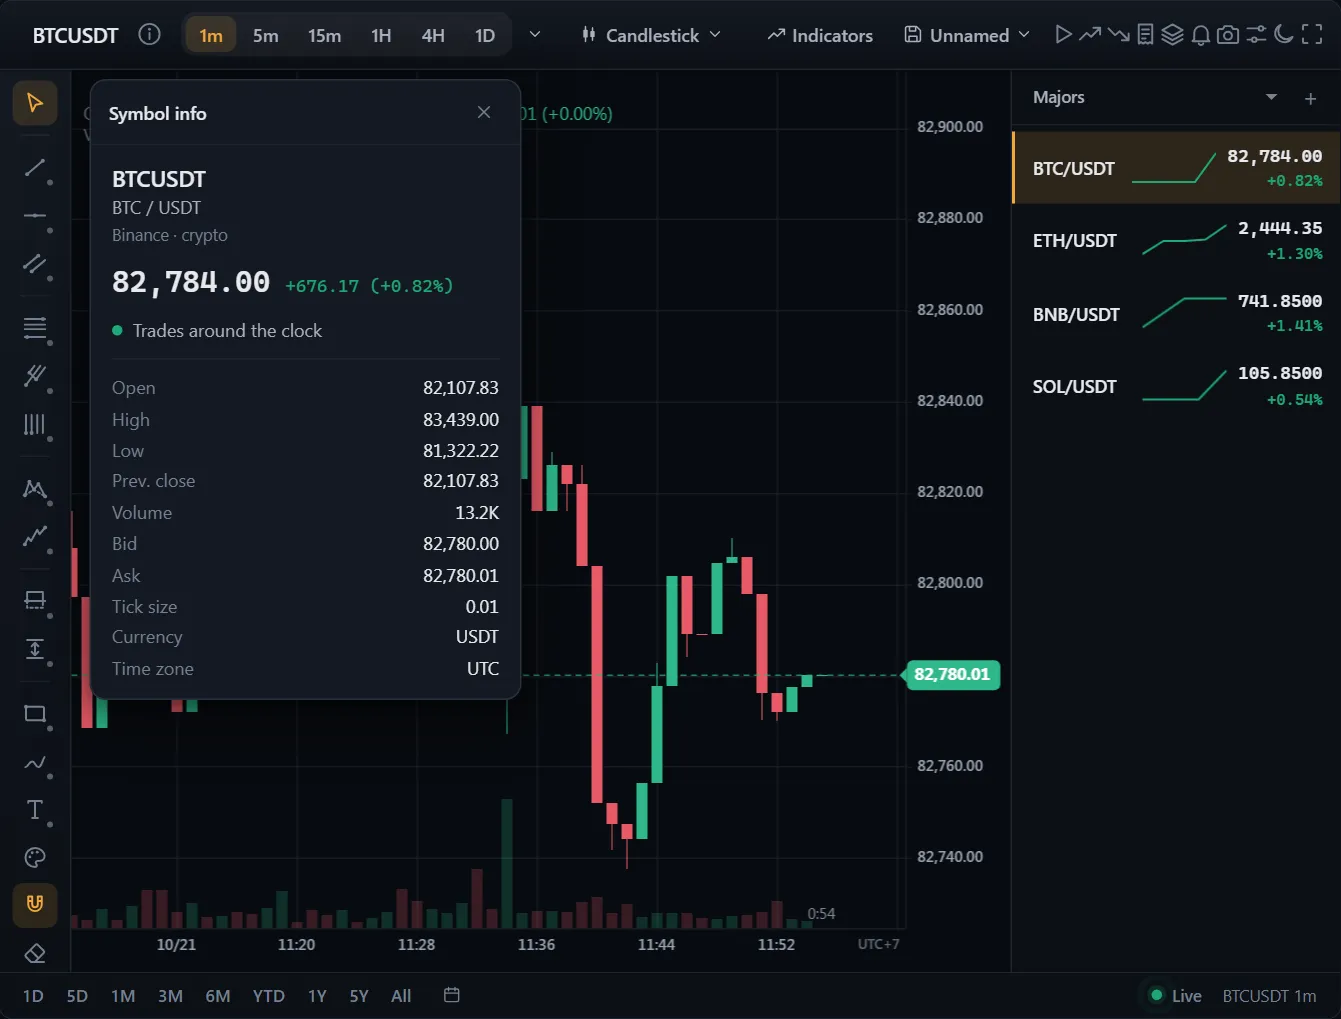
One focus: the screens people trade from. Charts, order entry, price boards and order flow, done properly.
Fast where trading gets heavy.
A million bars, a thousand symbols, ticks that never stop. Measured on a laptop with integrated graphics; run the same scenes on yours.
- 1,000,000
- bars in one chart, panned at 60 fps with WebGL, four indicators on
- ~0.001 ms
- to fold a live tick into four indicators on 100,000 bars
- 1,000
- symbols on one price board, every changed cell flashing
- 176 KB
- the headless chart, gzipped, with no dependencies
1600×900, zoomed out on 1,000,000 bars + 4 indicators · 2×
2560×1400, 2,000 candles + 4 indicators · 2×
Demos
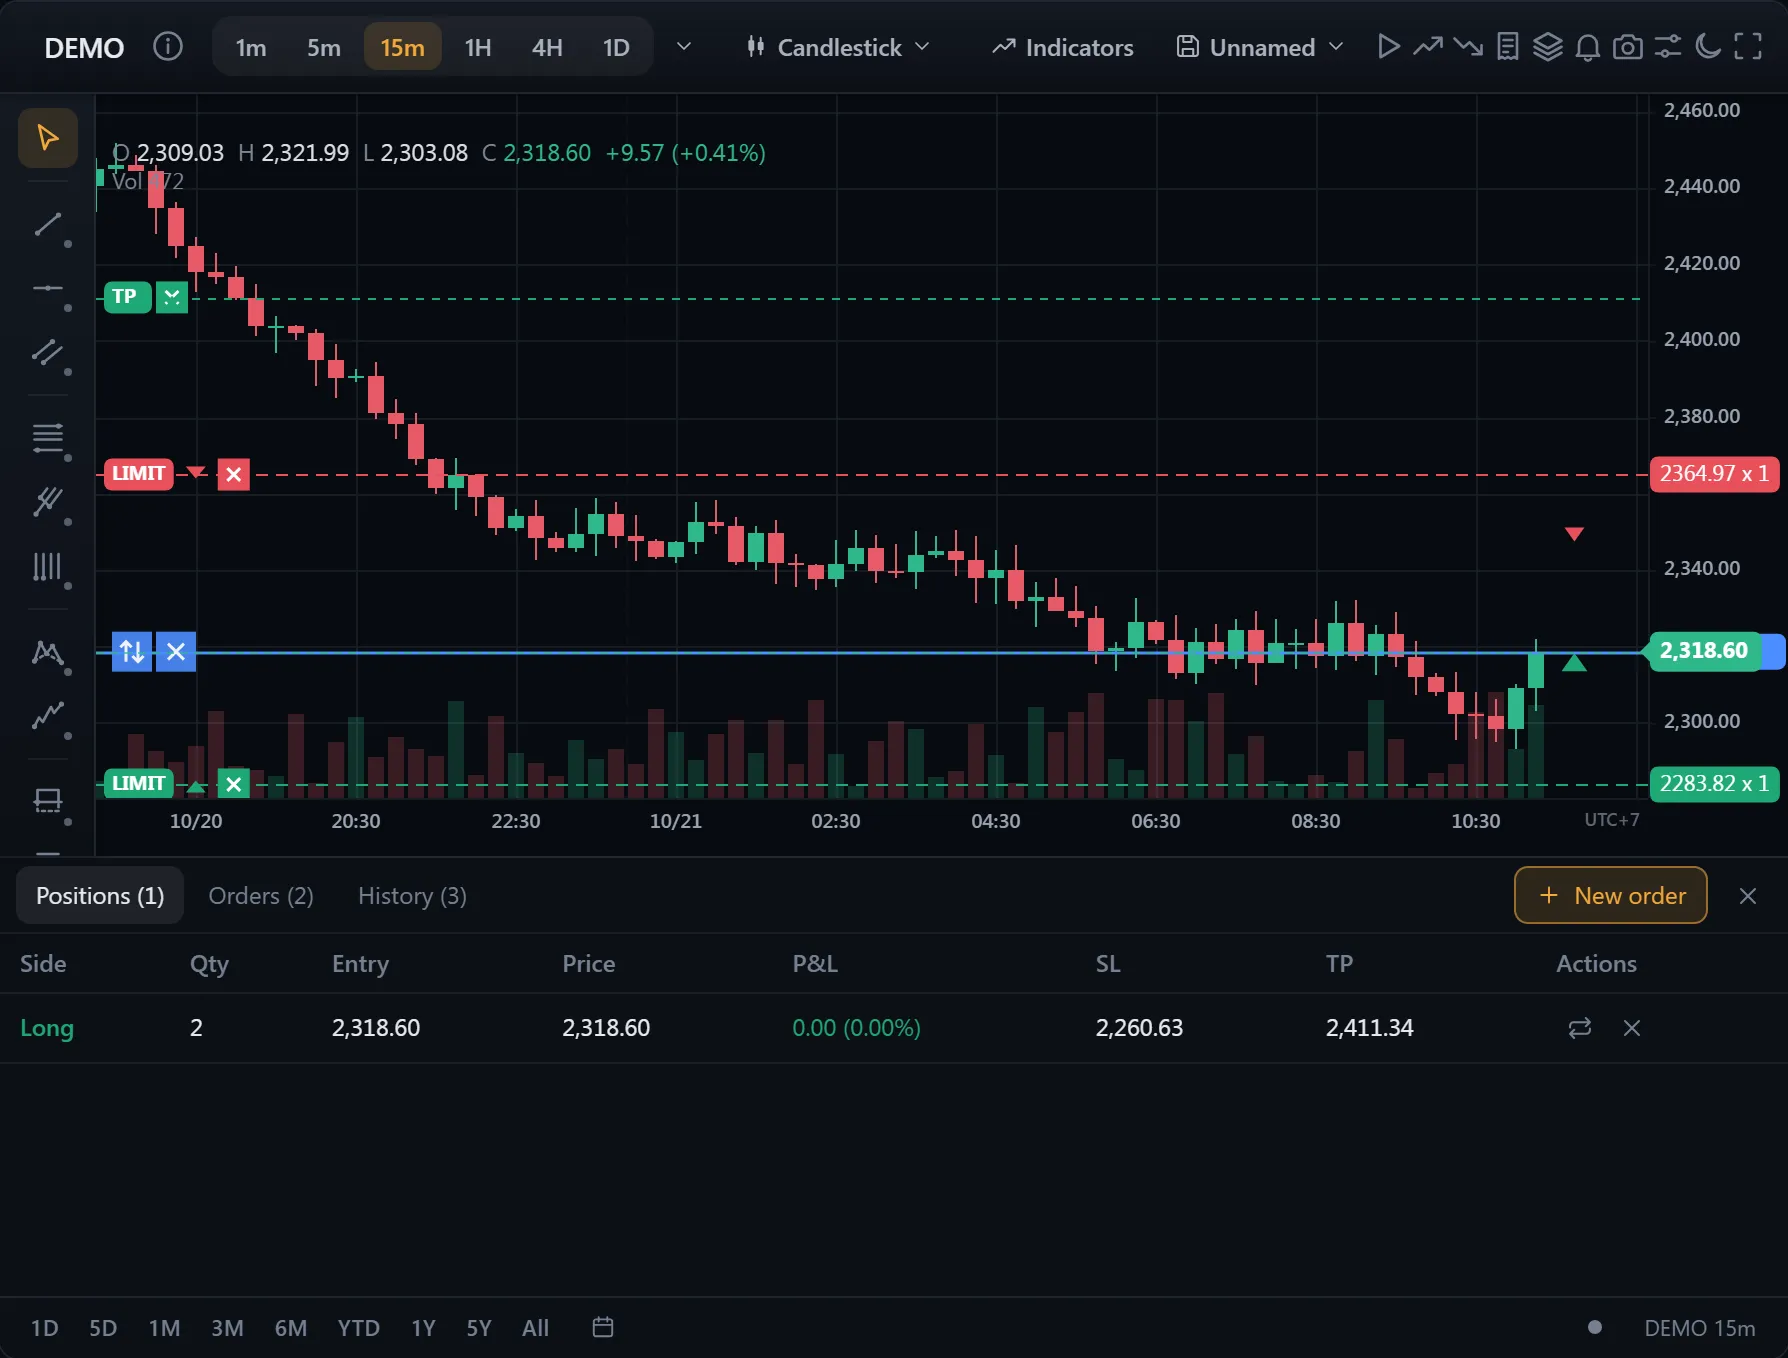 Orders and positions on the chartChartWidget
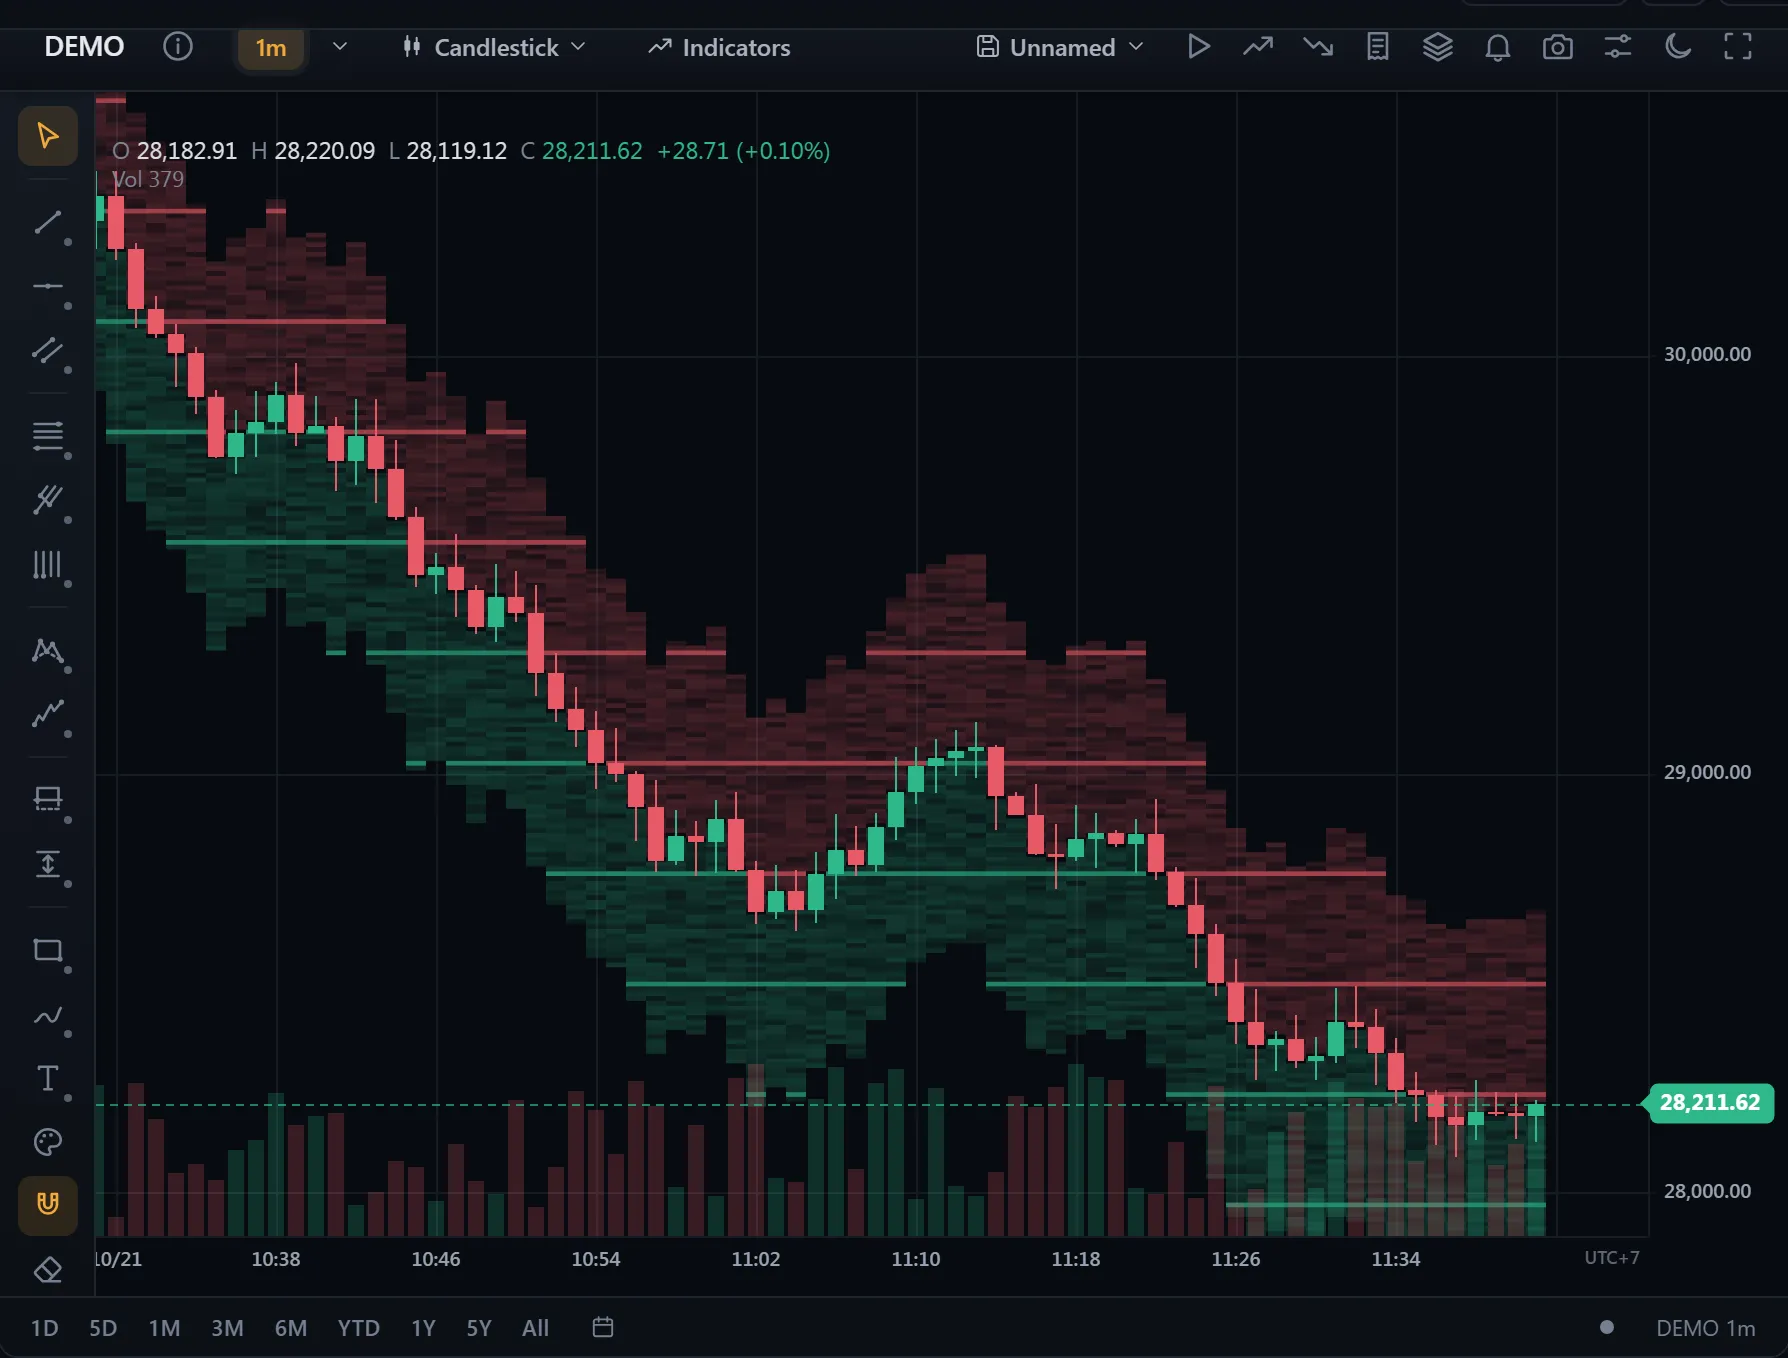
- Liquidity heatmapWebGL
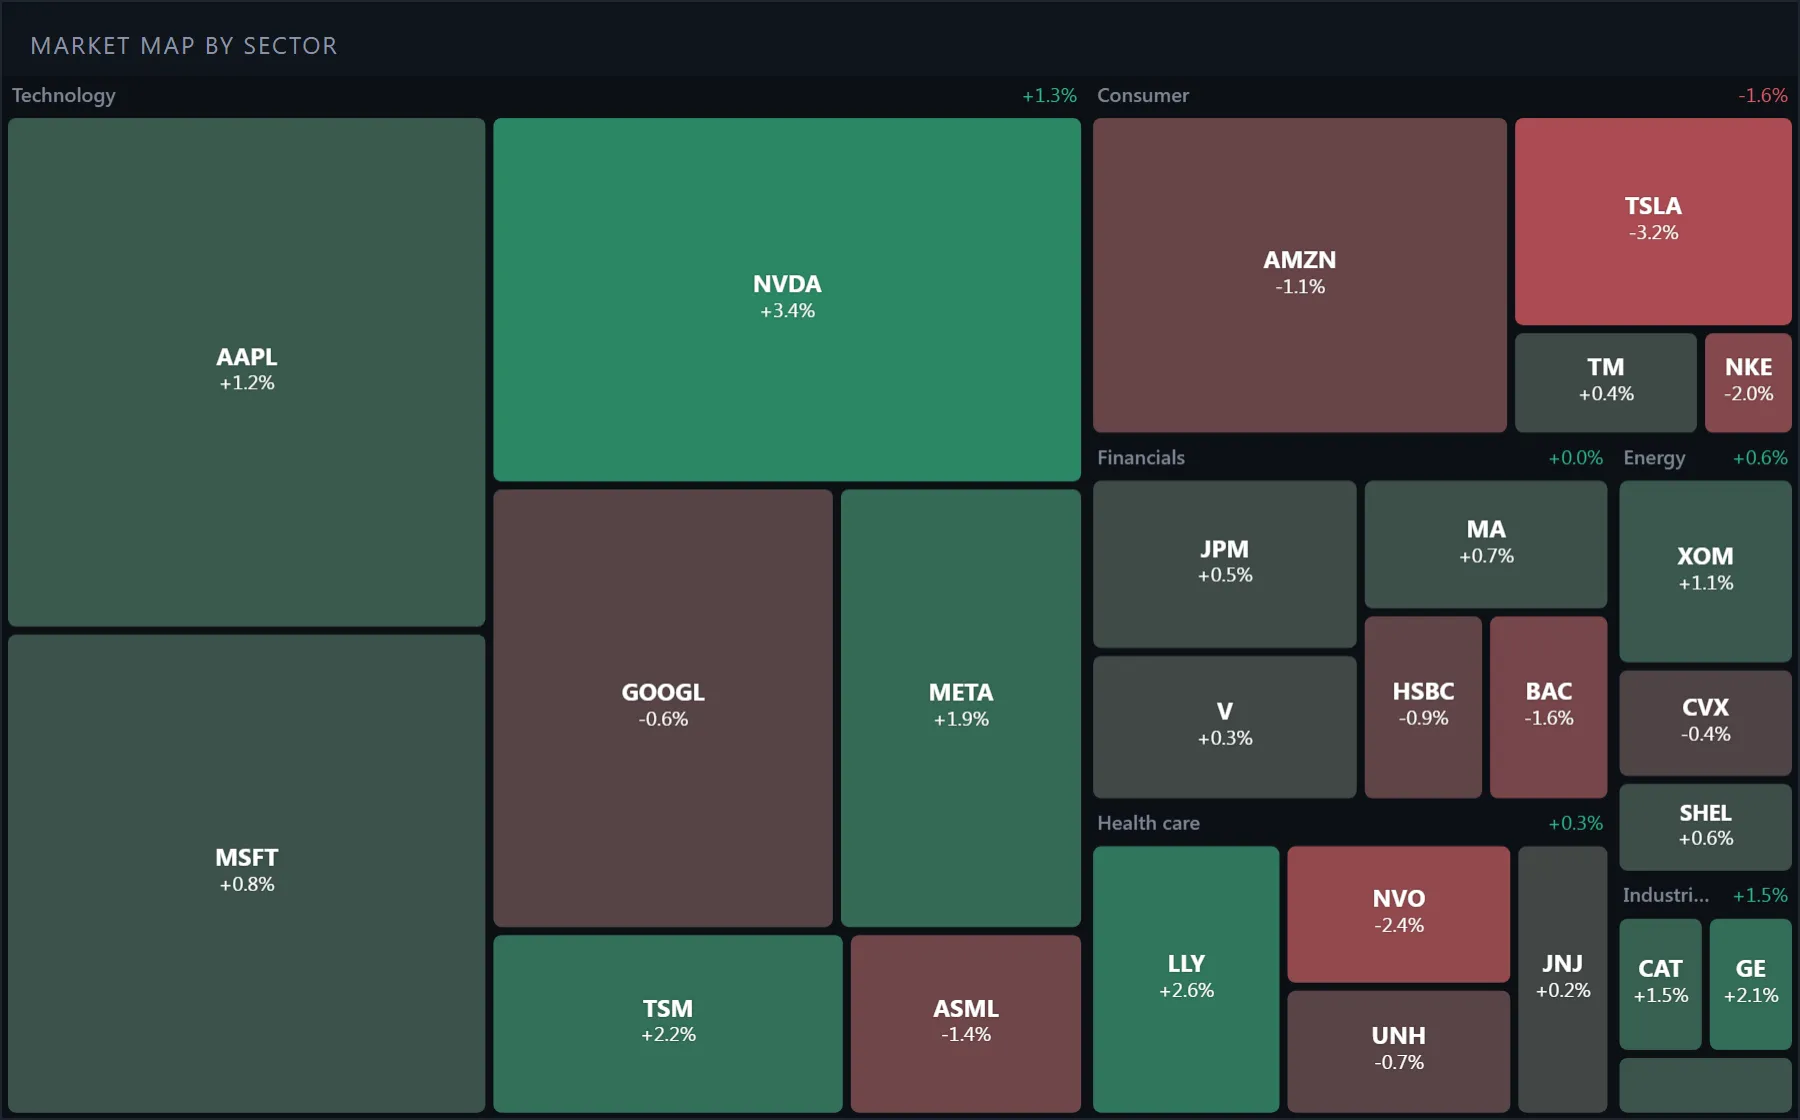
- Market map by sectorHeatmapChart
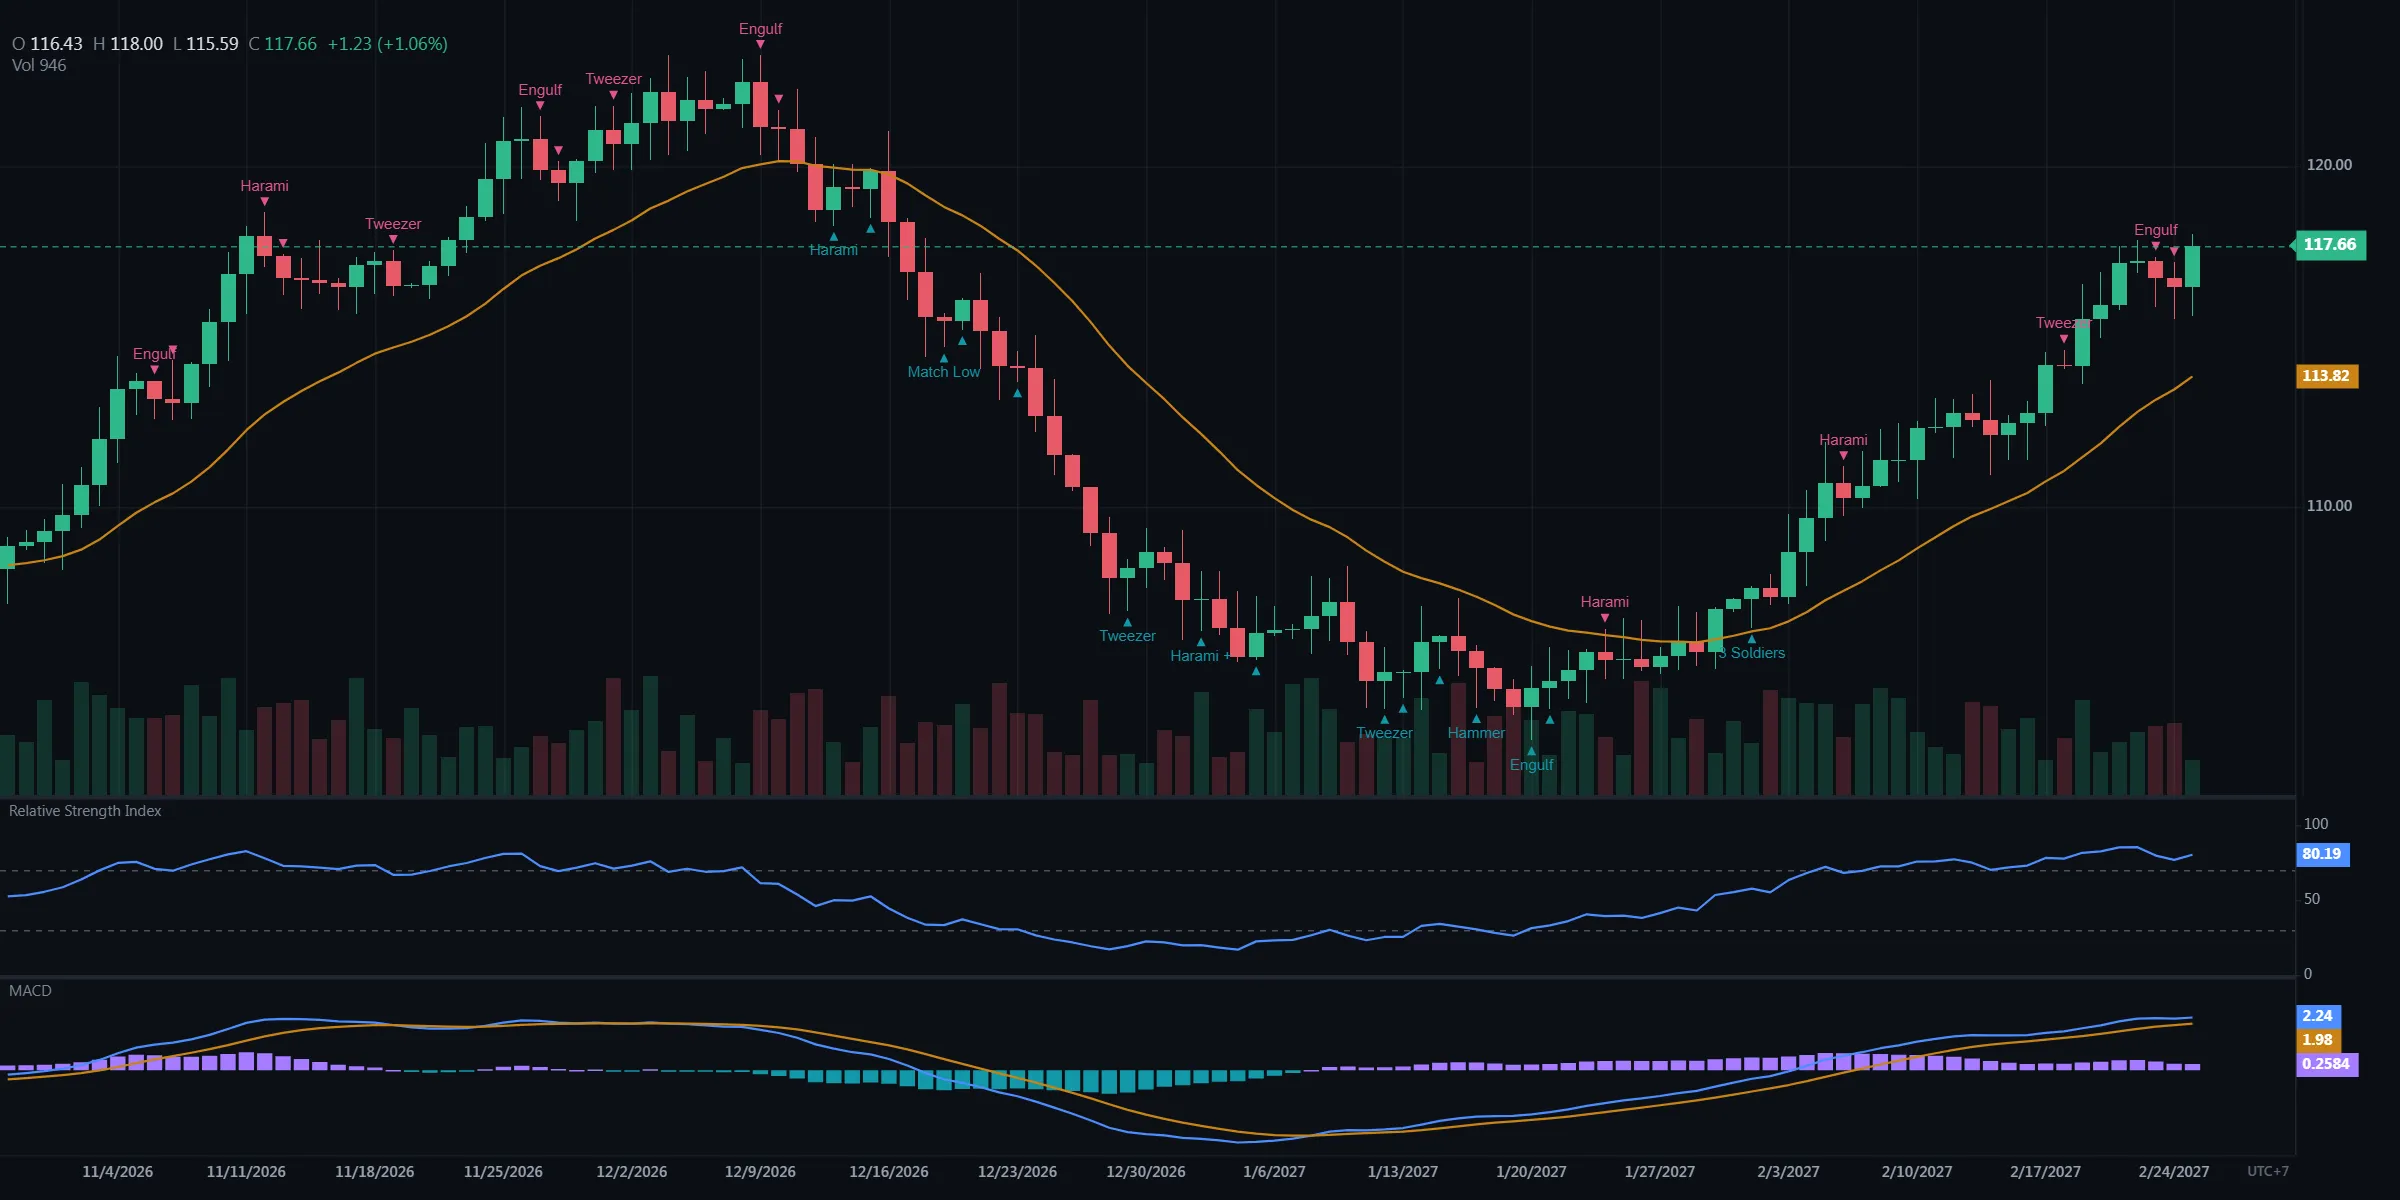 Patterns and indicator panescandlepatterns
- 69 drawing tools69 tools
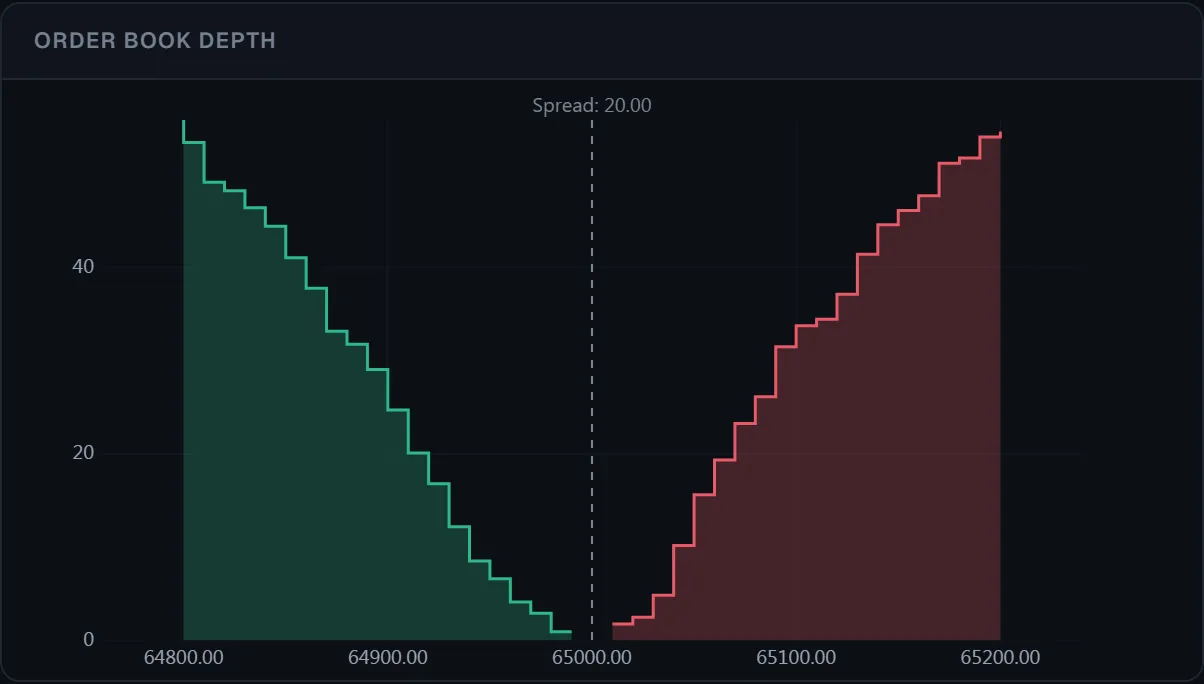 Order-book depthDepthChart
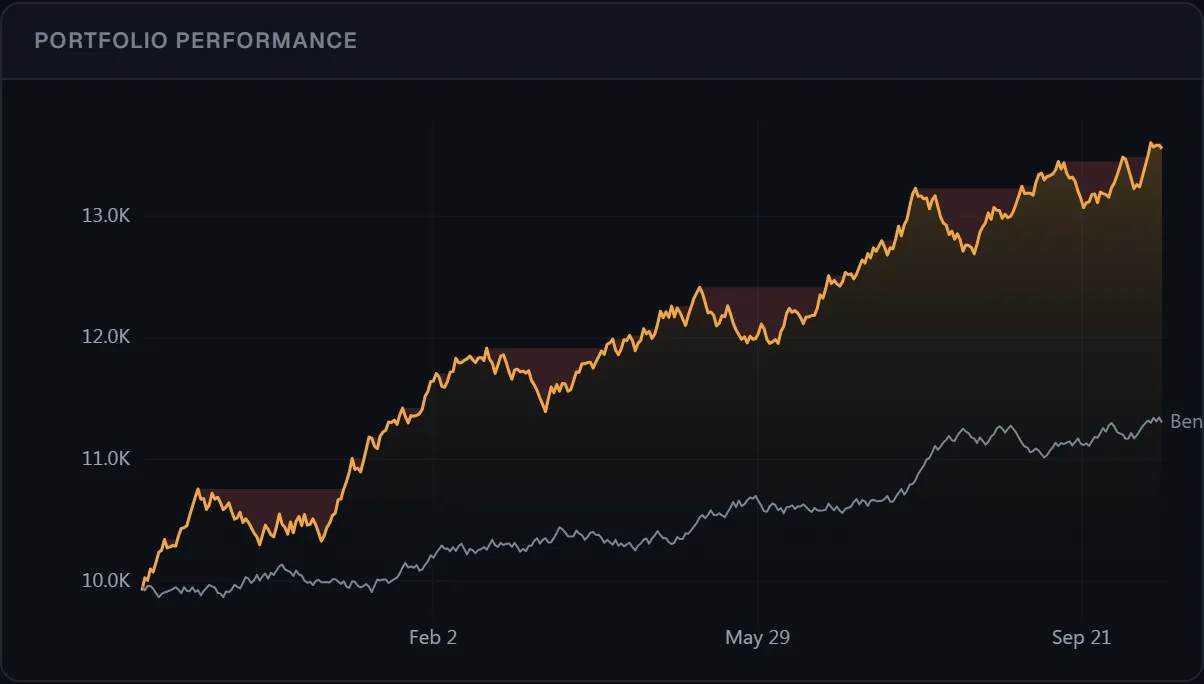 Equity curve and drawdownEquityCurveChart
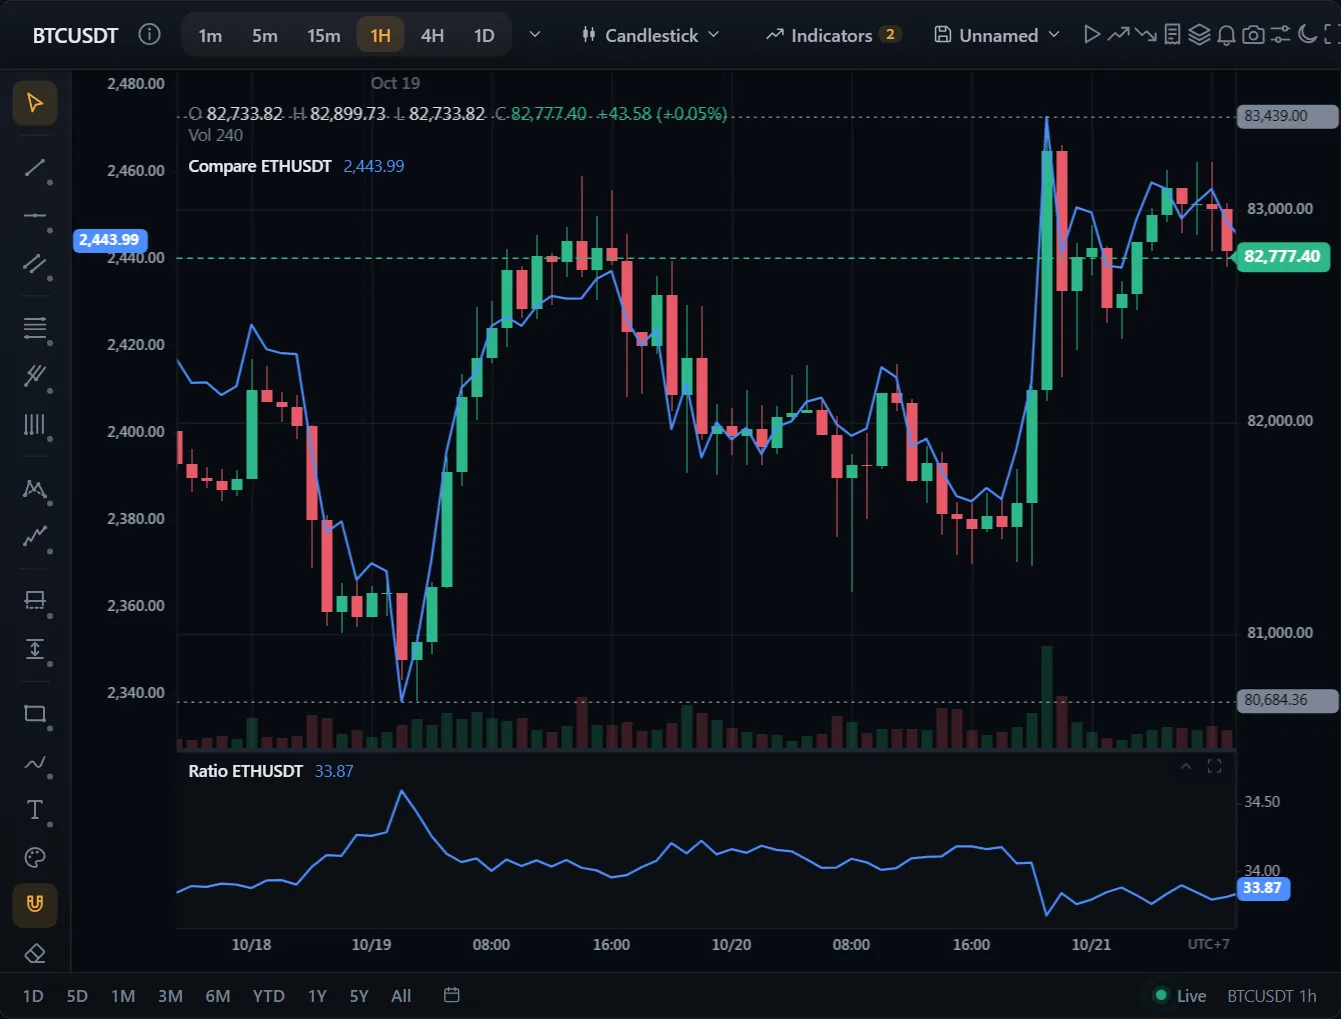 Compare, spread and ratioaddCompareSymbol
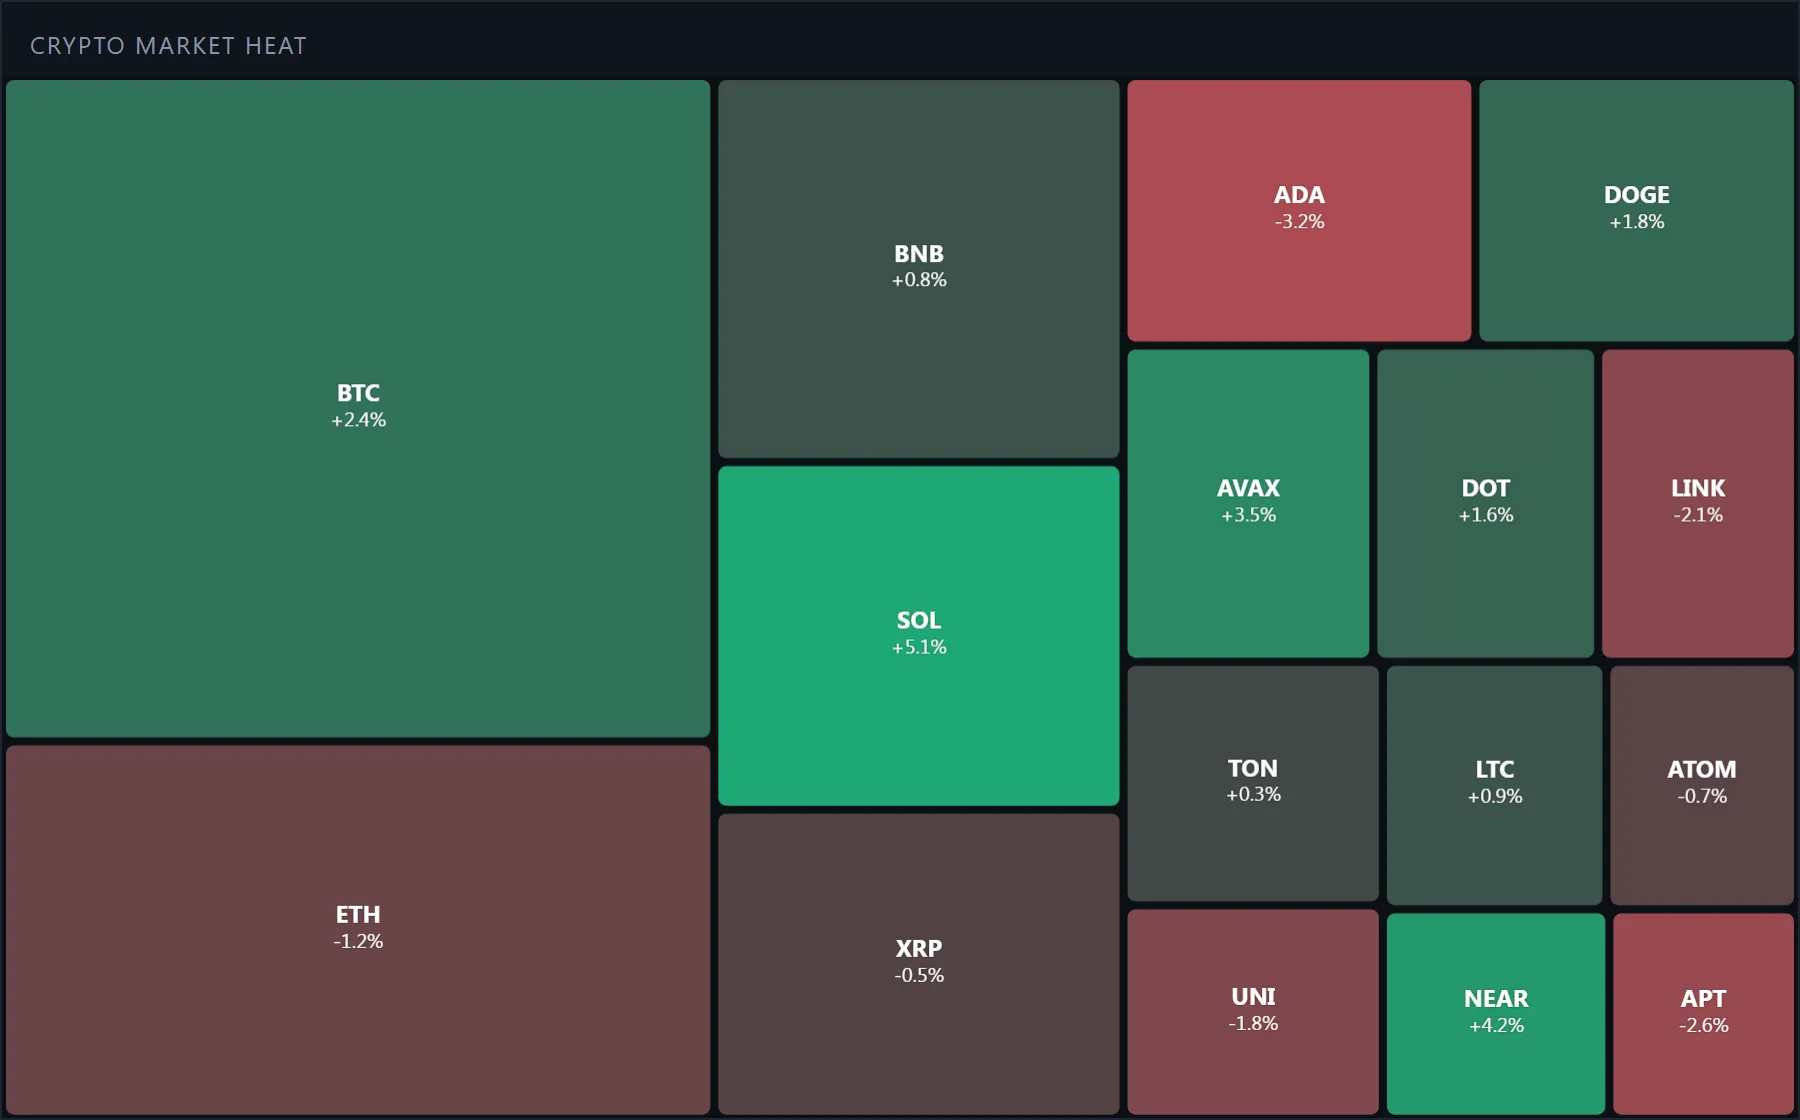 Crypto market heatHeatmapChart
 Daily P&L calendarCalendarChart
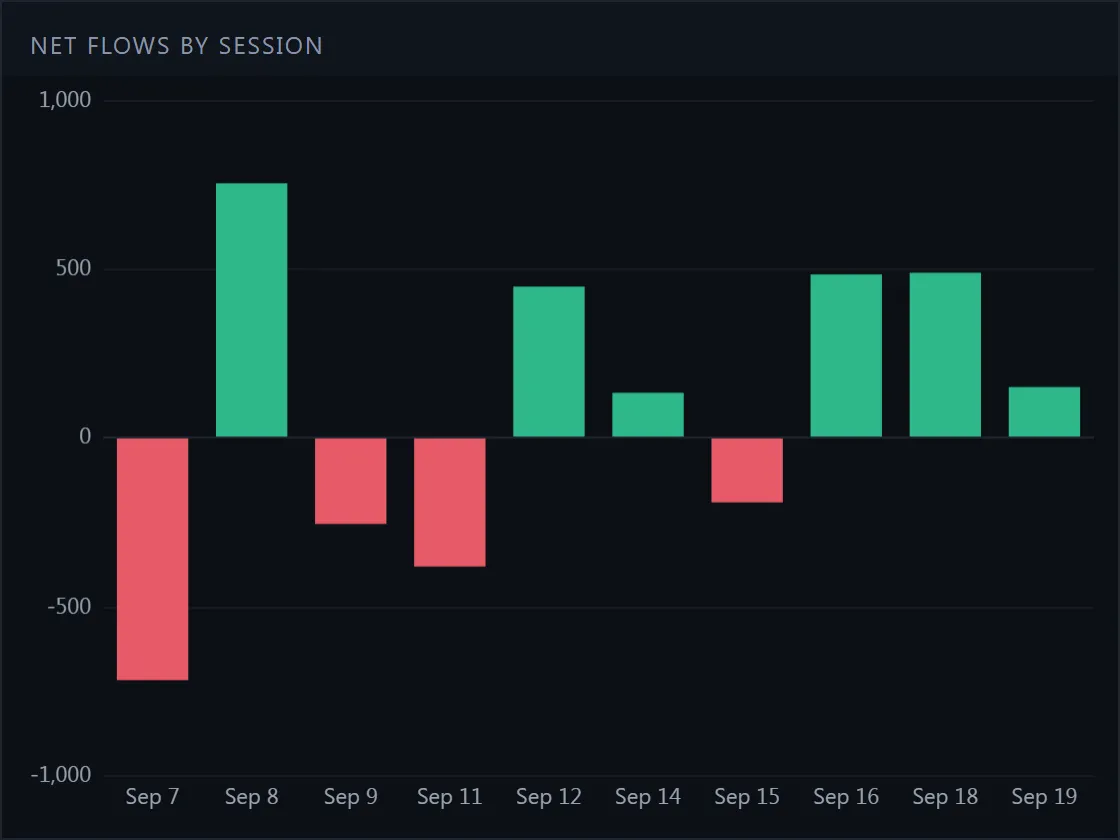 Net flows by sessionBarChart
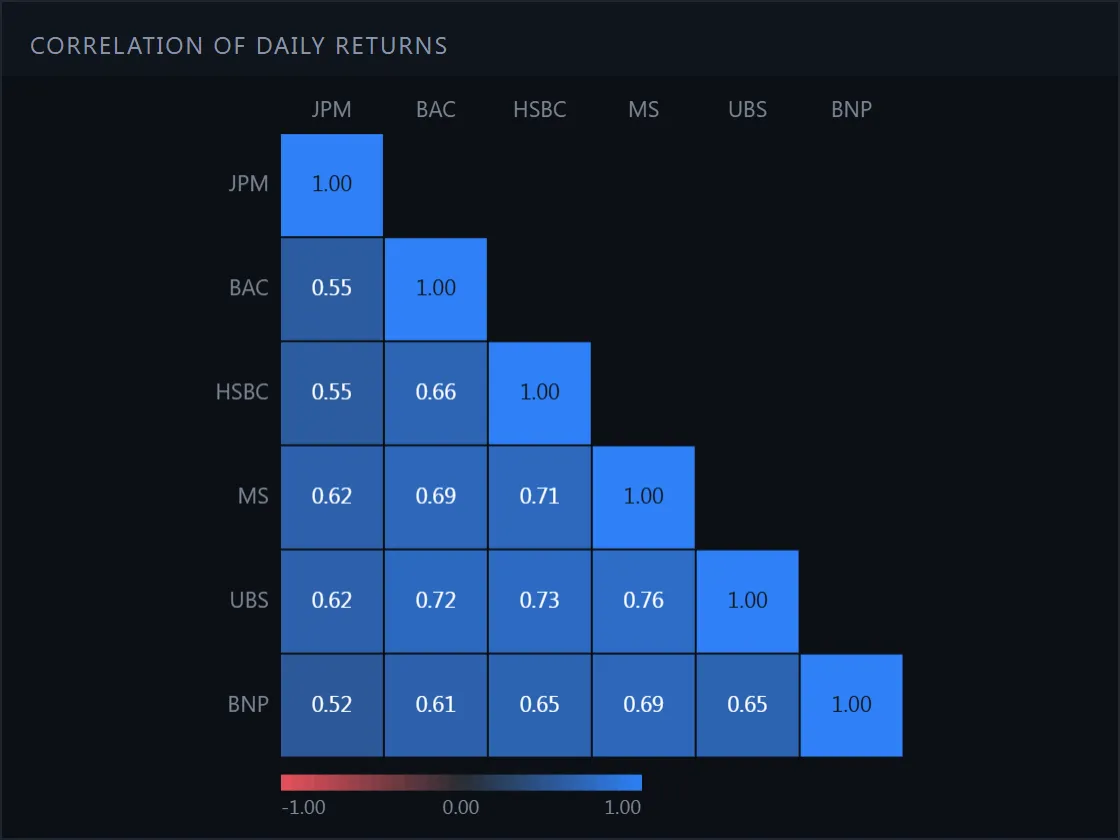 Correlation matrixMatrixChart
 Your own looksetUI
Building a trading screen with TradeCanvas?
We'd like to hear about it.
business@tradecanvas.devGet in touch