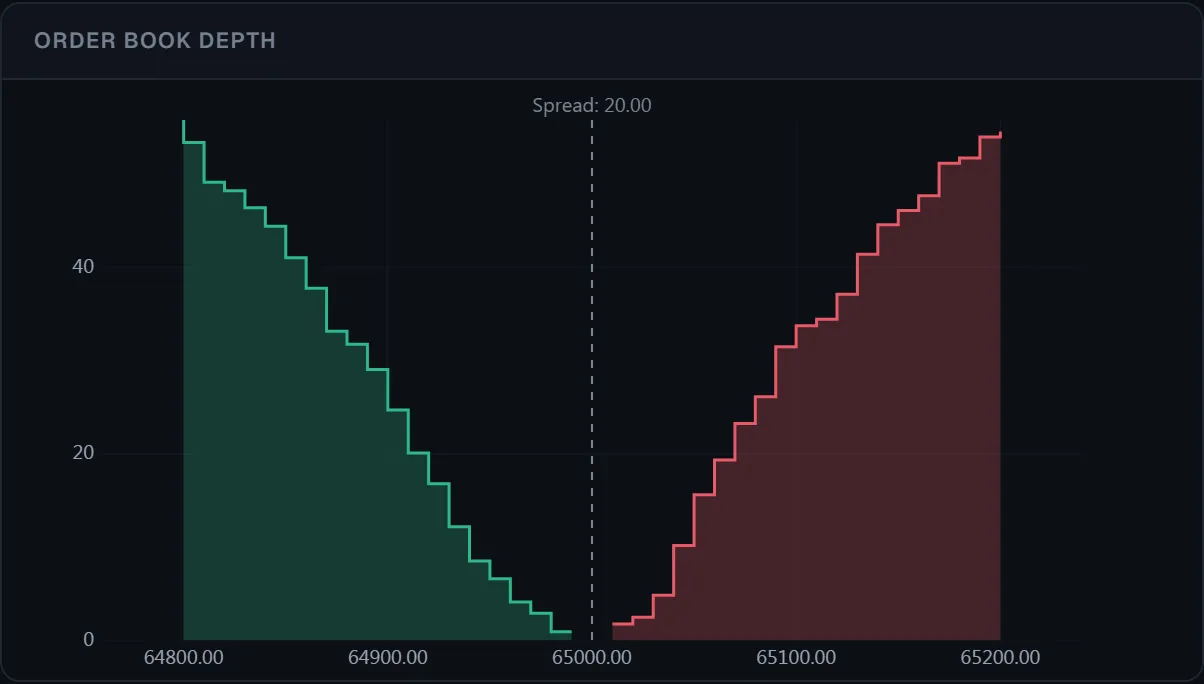
Liquidity heatmap
Code
Read the docs →import { Chart } from '@tradecanvas/chart'
const chart = new Chart(el, { theme: 'dark', renderer: 'webgl' })
chart.setData(bars)
chart.setDepthHeatmapVisible(true)
// Each order-book snapshot becomes a column of the heatmap behind the price
chart.pushDepthSnapshot(book, Date.now())● Simulated market data, generated in your browser
See the book, not only the last price: depth, a liquidity heatmap on the GPU, a click-to-trade ladder and volume profile.
API: pushDepthSnapshot