위험과 수익
코드
문서 보기 →import { ScatterChart } from '@tradecanvas/chart'
new ScatterChart(el, {
series: [{ name: 'Holdings', points }], // { label, x, y, size }
xLabel: 'Volatility',
yLabel: '1-year return',
showLabels: true,
theme: 'dark',
})● 브라우저에서 생성한 시뮬레이션 시장 데이터
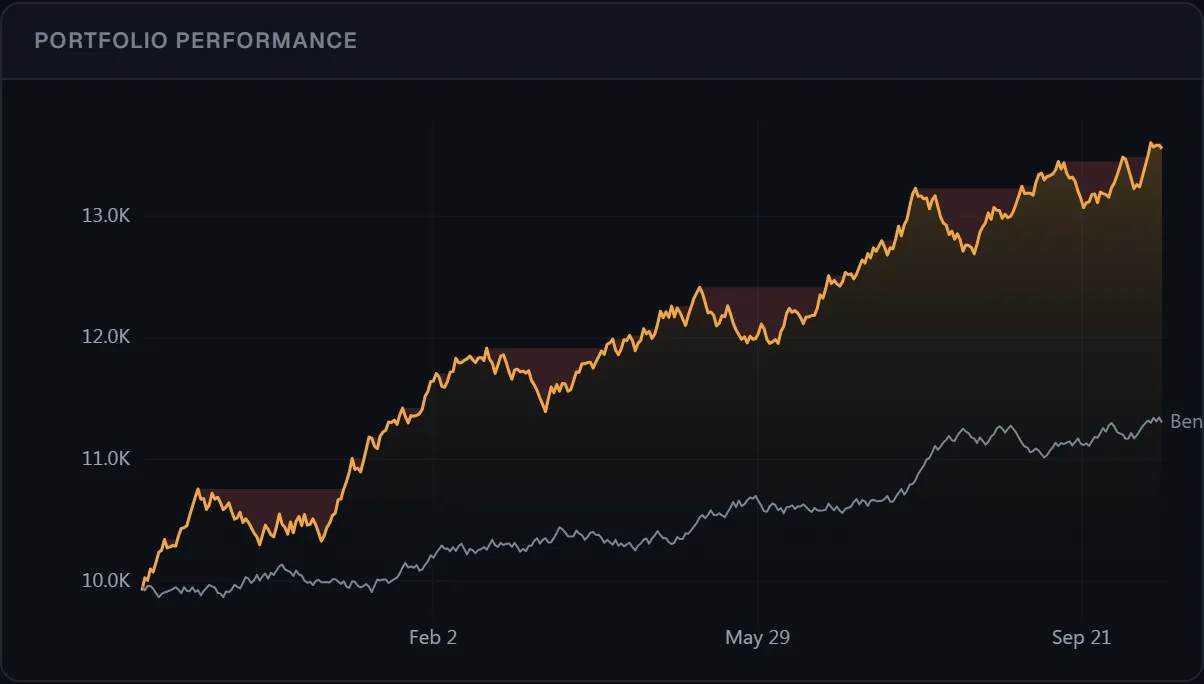
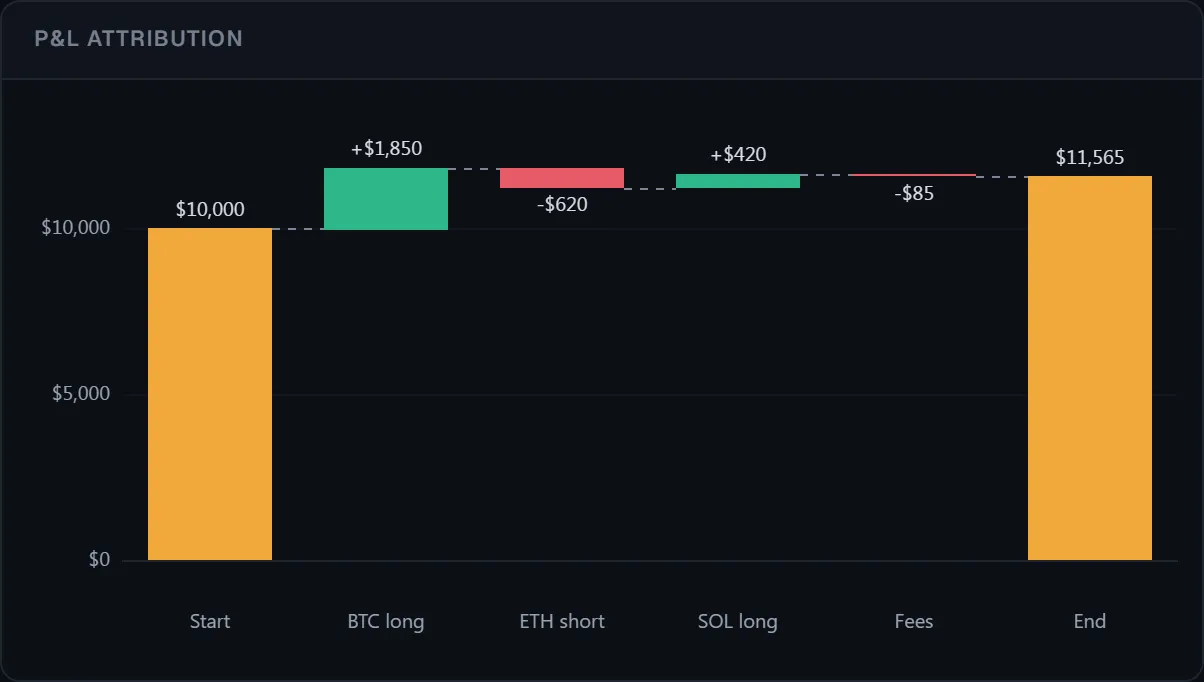
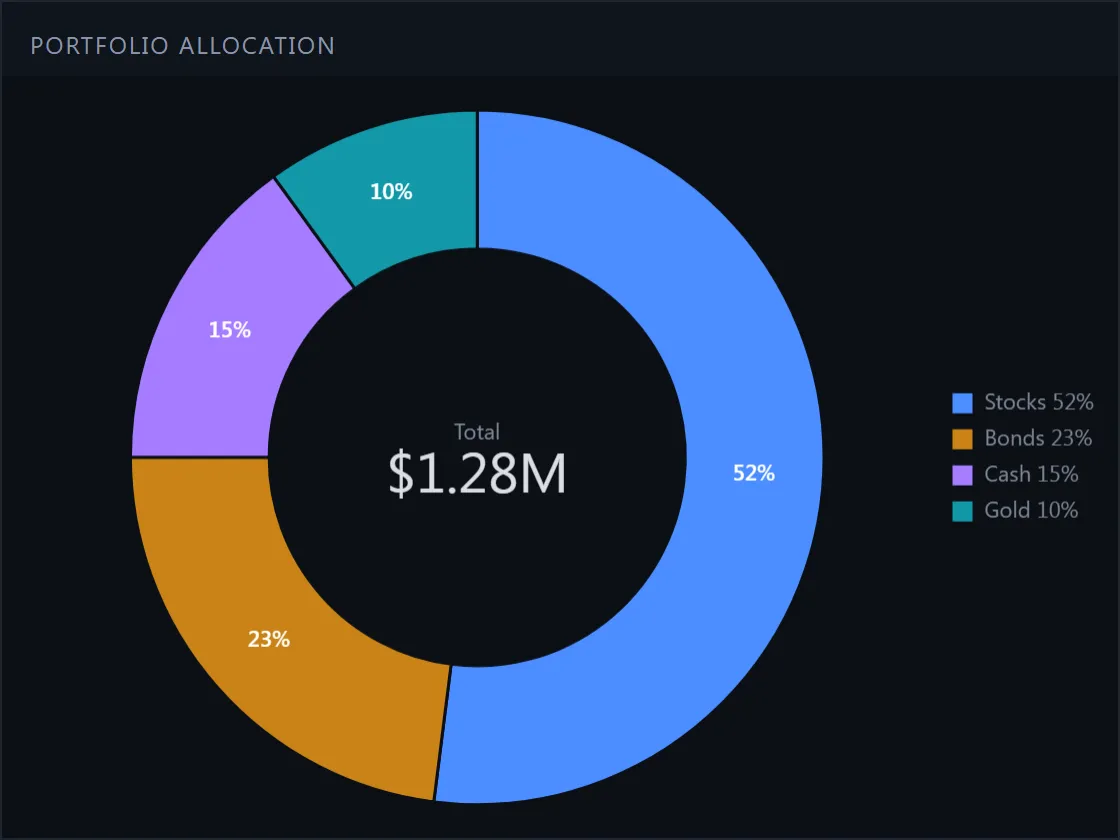
장 마감 후 트레이더가 보는 것: 손익, 낙폭, 자산 배분, 위험과 수익.
API: ScatterChart