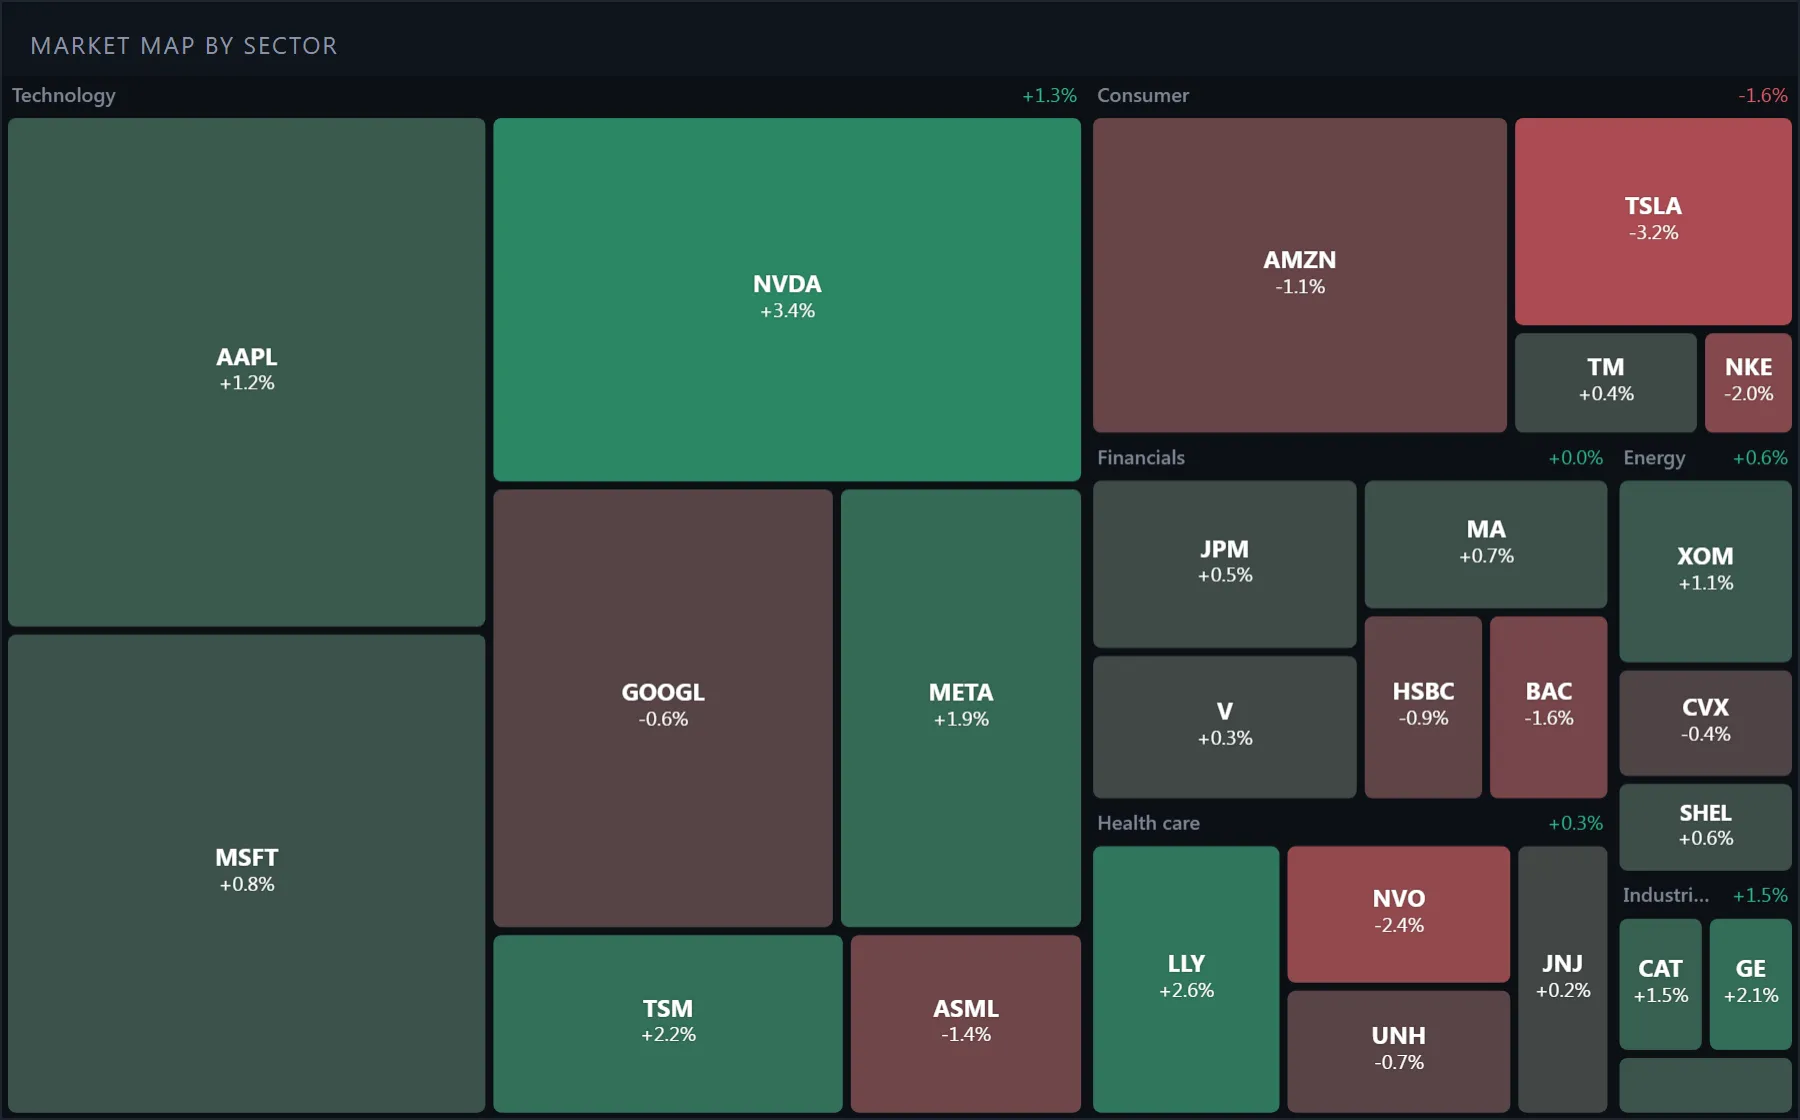
Crypto market heat
Code
Read the docs →import { HeatmapChart } from '@tradecanvas/chart'
new HeatmapChart(el, {
data: cells, // { id, label, value, weight, group }
weighted: true, // tile area by weight
valueFormat: (v) => `${v > 0 ? '+' : ''}${v.toFixed(1)}%`,
theme: 'dark',
})● Simulated market data, generated in your browser
A realtime board for any exchange: 1,000 symbols at 30,000 ticks a second, cells that flash on change, grouping, pivot and Excel export.
API: HeatmapChart