Watchlists and symbol details
Code
Read the docs →import { ChartWidget } from '@tradecanvas/chart/widget'
// feed: your DataAdapter (a WebSocketAdapter, or your own class)
const widget = new ChartWidget(document.getElementById('chart')!, {
symbol: 'AAPL',
timeframe: '5m',
theme: 'dark',
adapter: feed,
watchlist: {
lists: [{ id: 'main', name: 'Main', symbols: ['AAPL', 'MSFT', 'NVDA', 'BTCUSDT', 'EURUSD'] }],
},
// the rows tick from feed.subscribeQuotes()
})● Simulated market data, generated in your browser
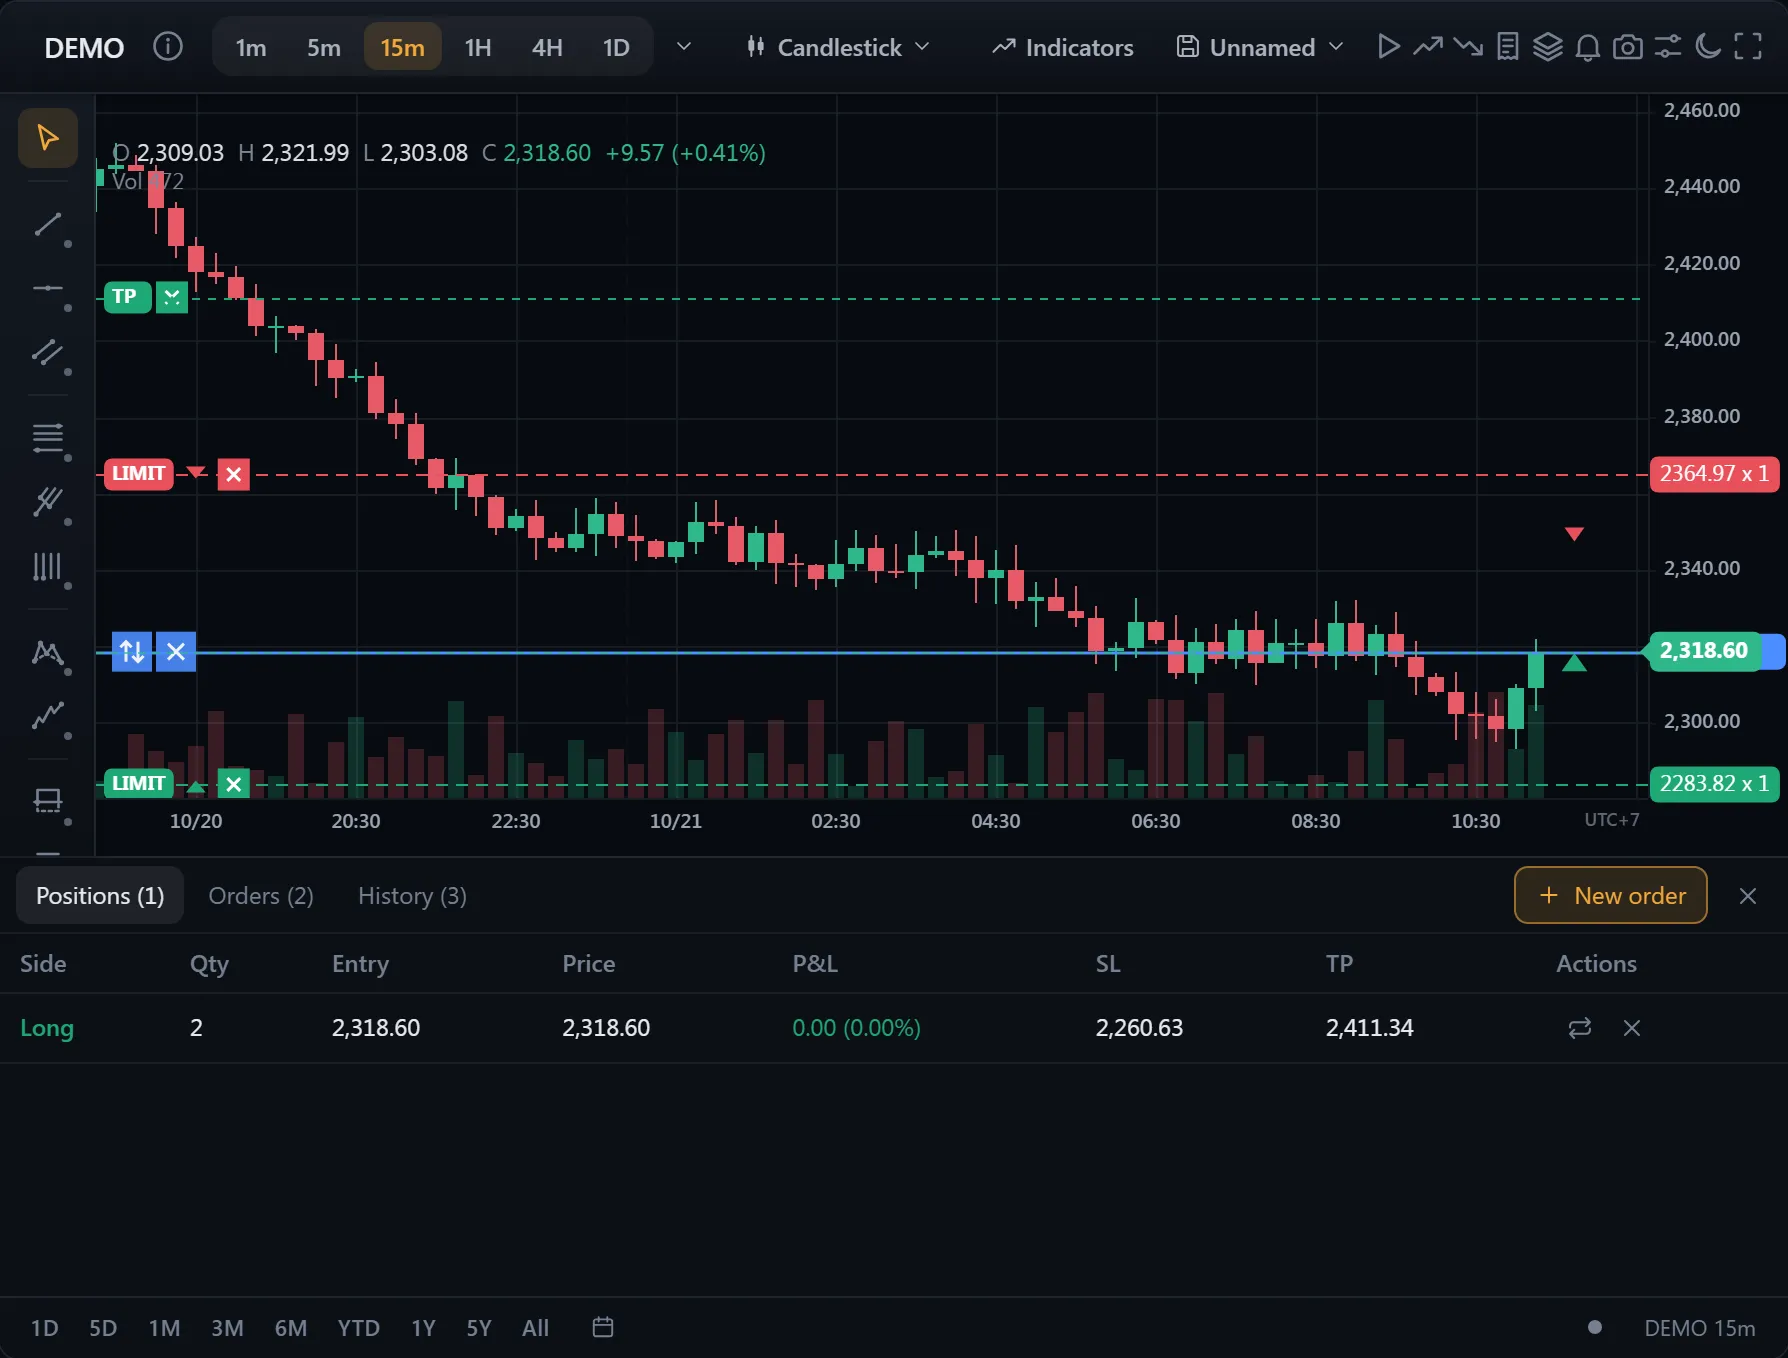
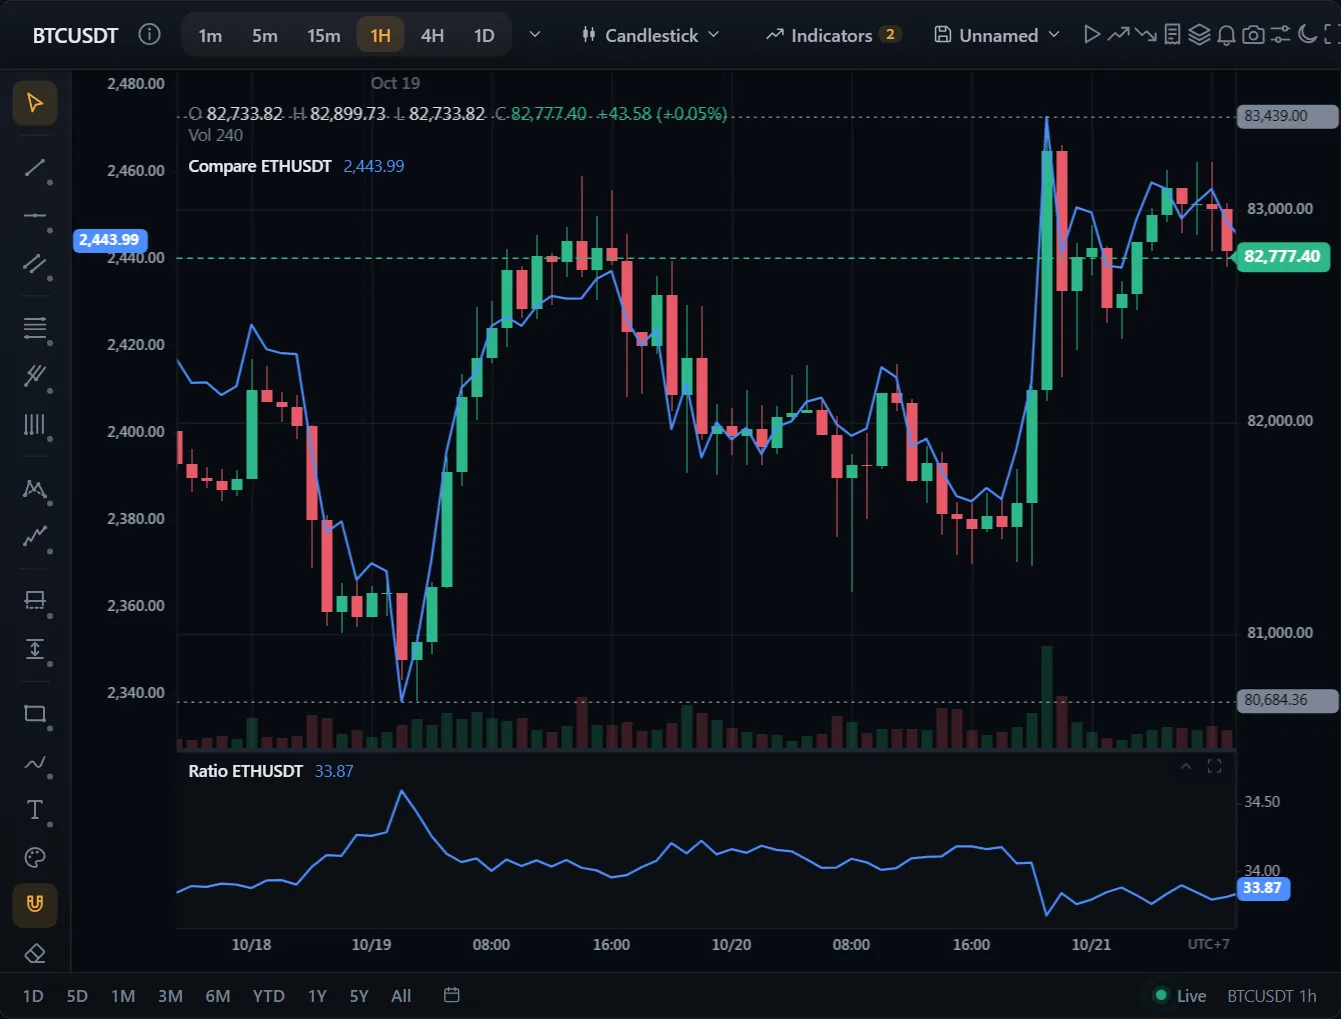
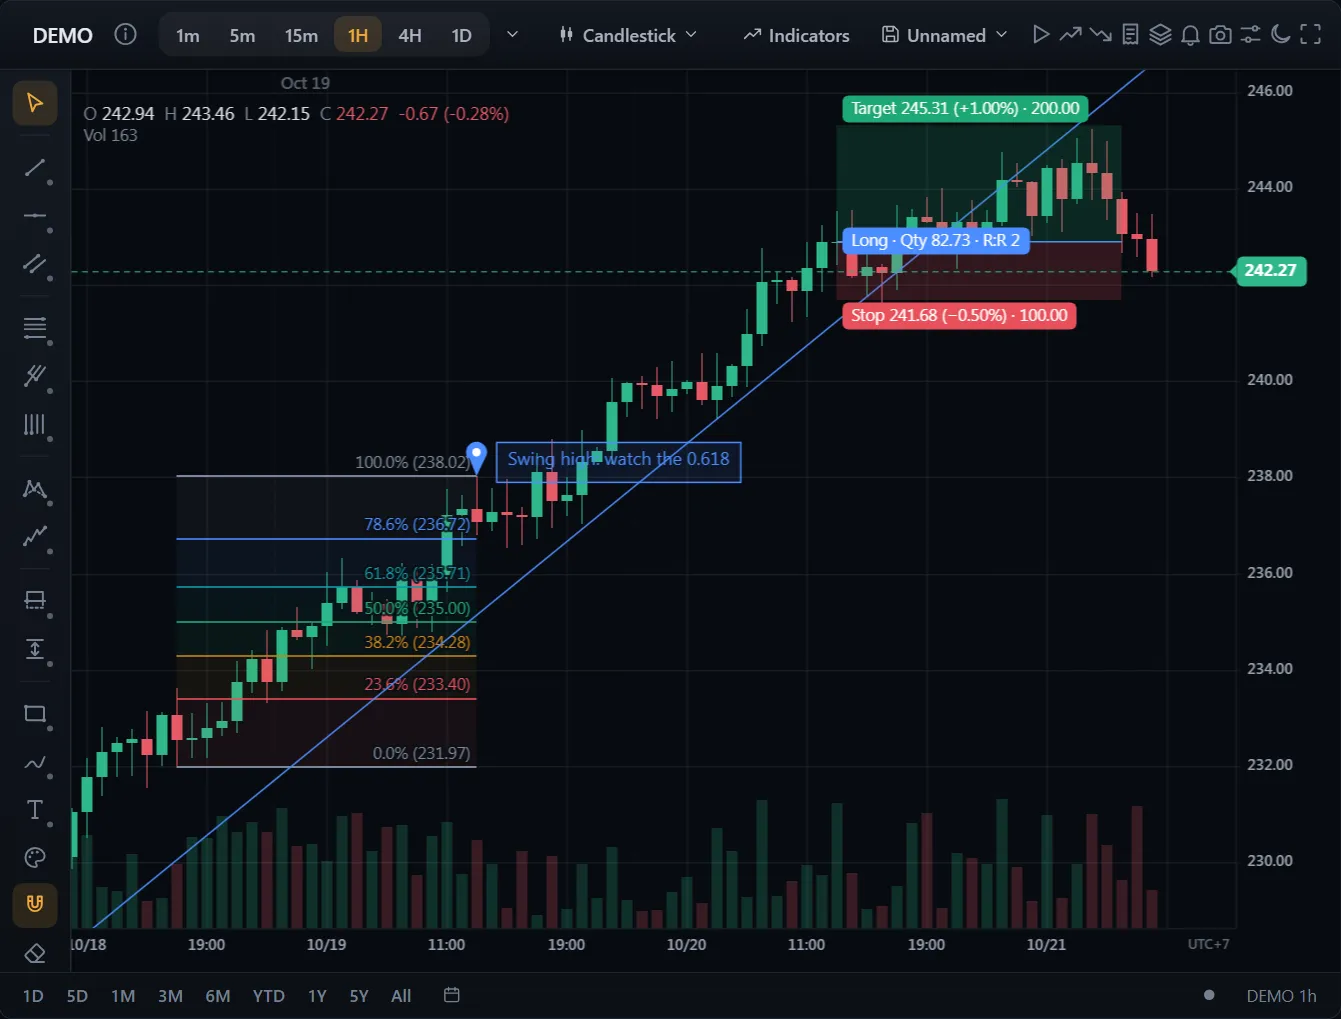
A complete screen out of the box: order ticket, orders and positions on the chart, stop-loss and take-profit you drag, watchlists, alerts and bar replay.
API: subscribeQuotes