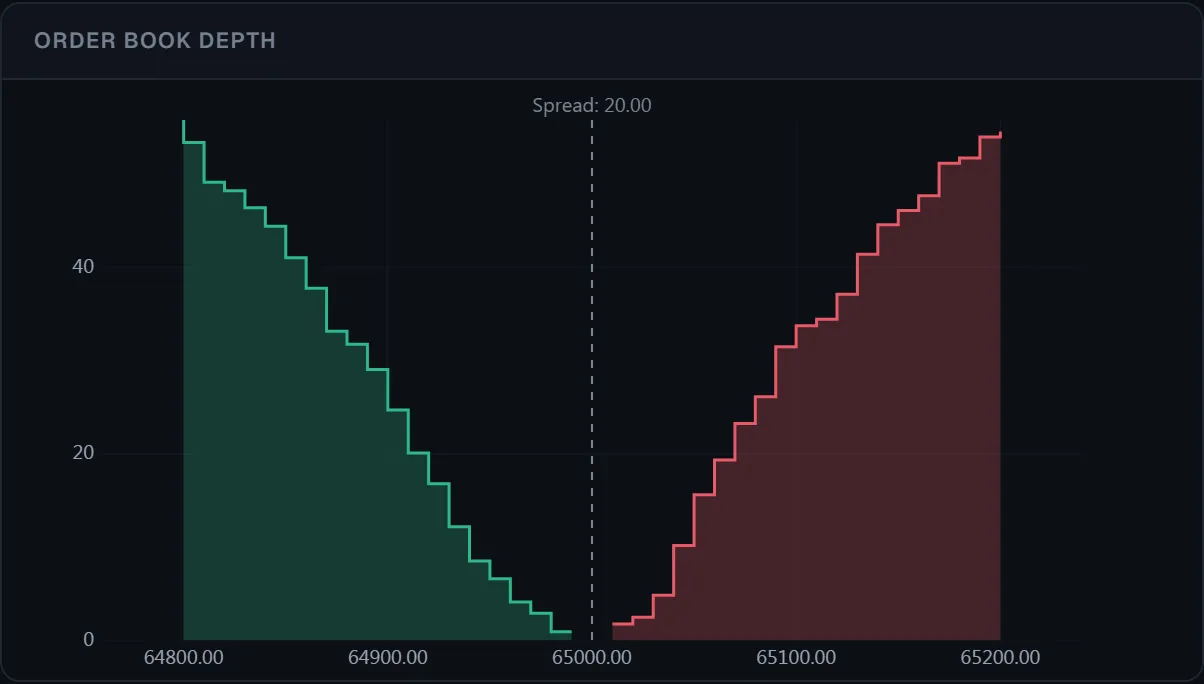
流動性ヒートマップ
コード
ドキュメントを見る →import { Chart } from '@tradecanvas/chart'
const chart = new Chart(el, { theme: 'dark', renderer: 'webgl' })
chart.setData(bars)
chart.setDepthHeatmapVisible(true)
// Each order-book snapshot becomes a column of the heatmap behind the price
chart.pushDepthSnapshot(book, Date.now())● ブラウザー内で生成したシミュレーション市場データ
最終値だけでなく板全体を見る: 厚み、GPU 流動性ヒートマップ、クリック発注ラダー、ボリュームプロファイル。
API: pushDepthSnapshot