資産配分
コード
ドキュメントを見る →import { DonutChart } from '@tradecanvas/chart'
new DonutChart(el, {
data: slices, // { label, value }
centerLabel: 'Total',
centerValue: '$1.28M',
theme: 'dark',
})● ブラウザー内で生成したシミュレーション市場データ
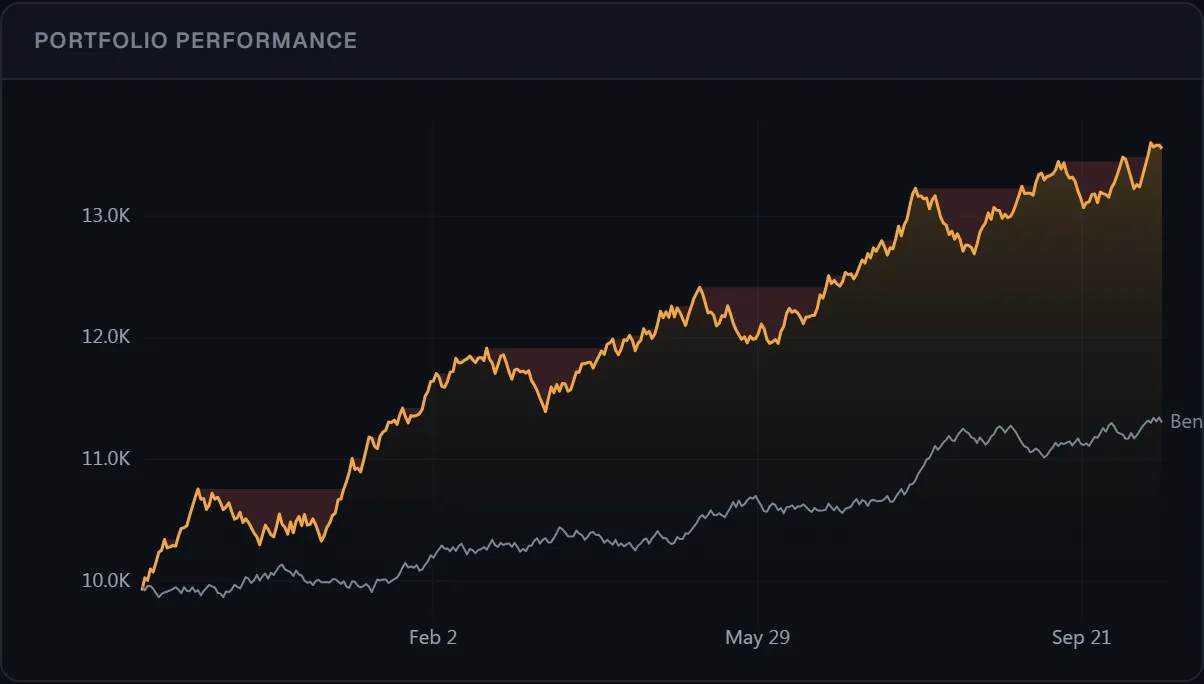
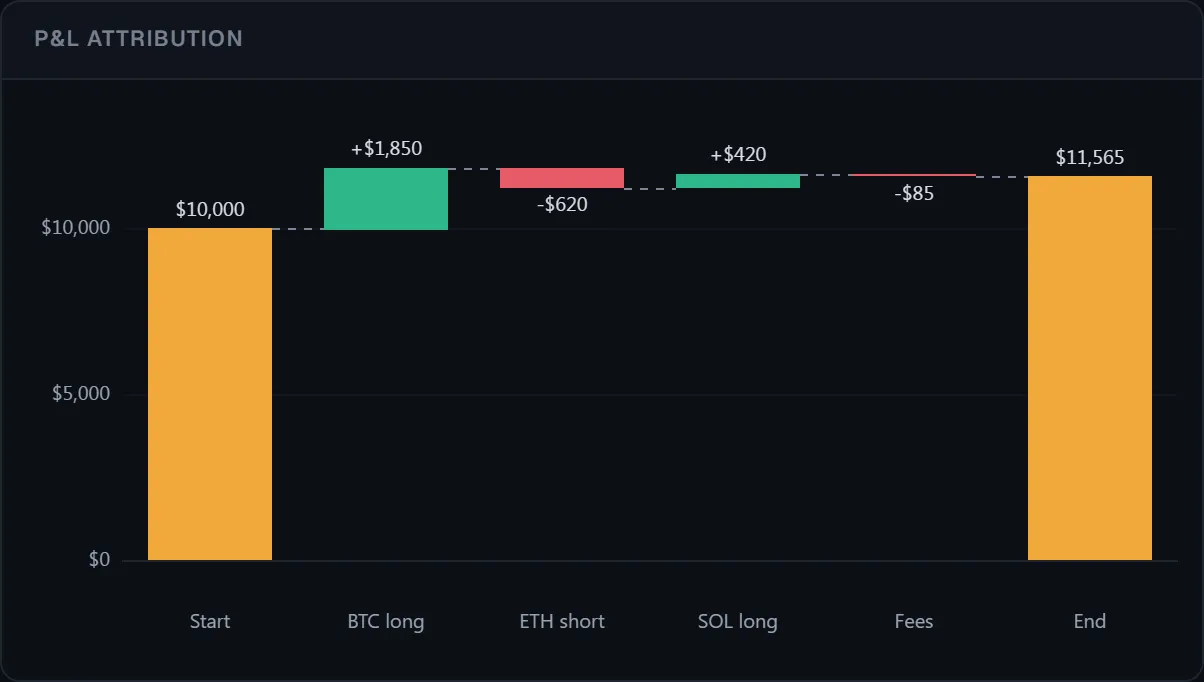
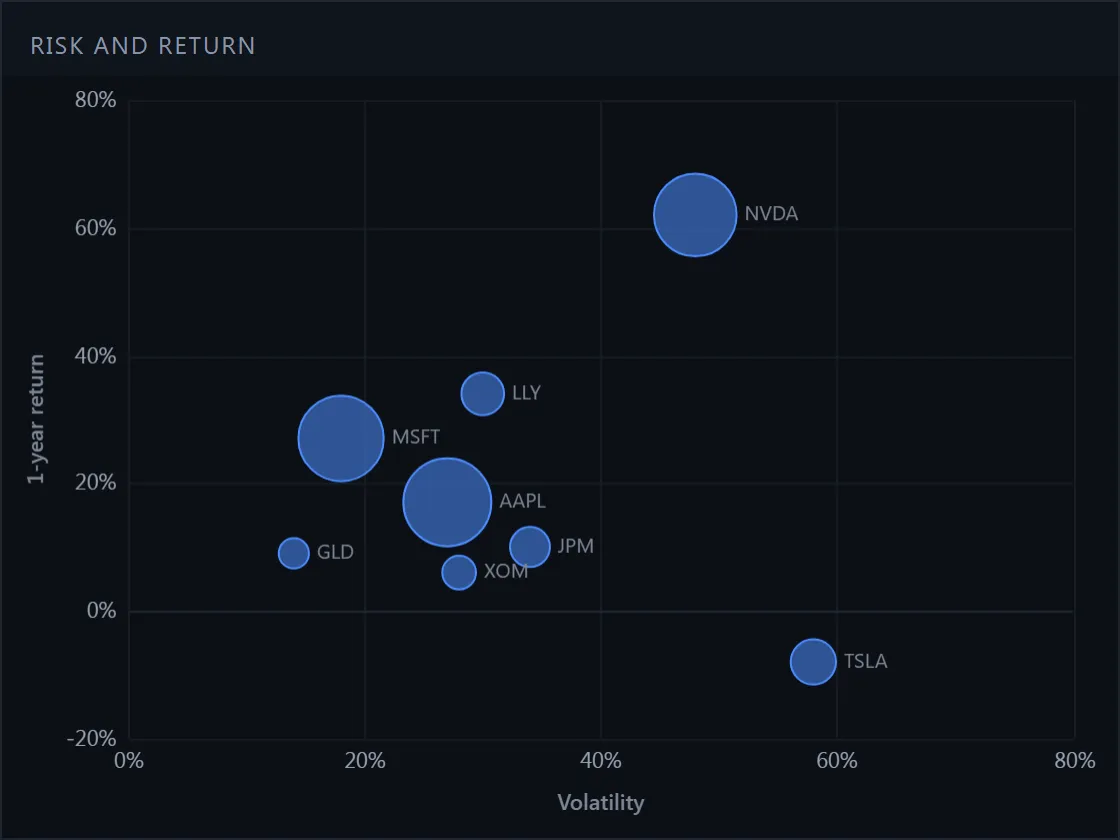
引け後にトレーダーが見るもの: 損益、ドローダウン、資産配分、リスクとリターン。
API: DonutChart